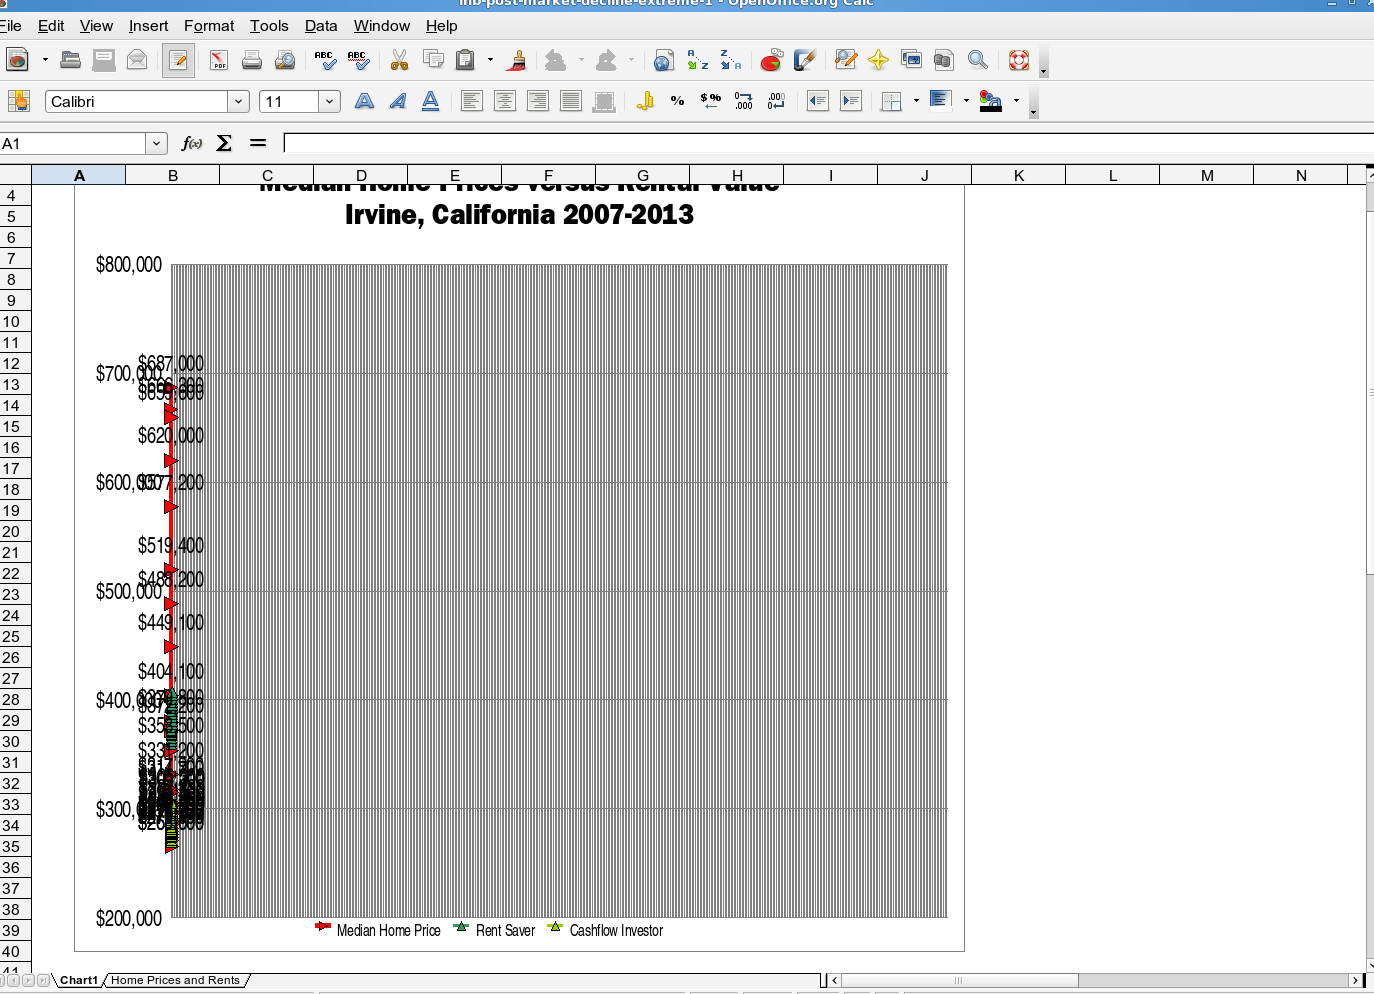
To comment on the following update, log in, then open the issue:
http://www.openoffice.org/issues/show_bug.cgi?id=81676
                 Issue #|81676
                 Summary|chart renders incorrectly in OOo 2.3.0
               Component|Spreadsheet
                 Version|OOo 2.3 RC3
                Platform|All
                     URL|http://www.irvinehousingblog.com/wp-content/uploads/20
                        |07/03/ihb-post-market-decline-extreme.xls
              OS/Version|Linux
                  Status|UNCONFIRMED
       Status whiteboard|
                Keywords|
              Resolution|
              Issue type|DEFECT
                Priority|P3
            Subcomponent|viewing
             Assigned to|spreadsheet
             Reported by|ywwg
------- Additional comments from [EMAIL PROTECTED] Tue Sep 18 00:31:19 +0000
2007 -------
The chart linked from this blog post:
http://www.irvinehousingblog.com/2007/09/13/the-last-market-bottom/  renders
incorrectly in OOo 2.3, but correctly in 2.2.0 (Ubuntu).  The exact URL of the
chart is:

http://www.irvinehousingblog.com/wp-content/uploads/2007/03/ihb-post-market-decline-extreme.xls

The web page contains a picture of what the chart should look like, and Ithis is
what I get:
http://ywwg.com/images/bad_chart.png

---------------------------------------------------------------------
Please do not reply to this automatically generated notification from
Issue Tracker. Please log onto the website and enter your comments.
http://qa.openoffice.org/issue_handling/project_issues.html#notification

---------------------------------------------------------------------
To unsubscribe, e-mail: [EMAIL PROTECTED]
For additional commands, e-mail: [EMAIL PROTECTED]


---------------------------------------------------------------------
To unsubscribe, e-mail: [EMAIL PROTECTED]
For additional commands, e-mail: [EMAIL PROTECTED]