On 23/09/2025 14:01, Philipp Stanner wrote:
On Wed, 2025-09-03 at 11:18 +0100, Tvrtko Ursulin wrote:
To make evaluating different scheduling policies easier (no need for
external benchmarks) and perfectly repeatable, lets add some synthetic
workloads built upon mock scheduler unit test infrastructure.

Focus is on two parallel clients (two threads) submitting different job
patterns and logging their progress and some overall metrics. This is
repeated for both scheduler credit limit 1 and 2.

Example test output:

   Normal and low:
                     pct1 cps1 qd1;  pct2 cps2 qd2
         +     0ms:   0     0    0;   0     0    0
         +   104ms: 100  1240  112; 100  1240  125
         +   209ms: 100     0   99; 100     0  125
         +   313ms: 100     0   86; 100     0  125
         +   419ms: 100     0   73; 100     0  125
         +   524ms: 100     0   60; 100     0  125
         +   628ms: 100     0   47; 100     0  125
         +   731ms: 100     0   34; 100     0  125
         +   836ms: 100     0   21; 100     0  125
         +   939ms: 100     0    8; 100     0  125
         +  1043ms:               ; 100     0  120
         +  1147ms:               ; 100     0  107
         +  1252ms:               ; 100     0   94
         +  1355ms:               ; 100     0   81
         +  1459ms:               ; 100     0   68
         +  1563ms:               ; 100     0   55
         +  1667ms:               ; 100     0   42
         +  1771ms:               ; 100     0   29
         +  1875ms:               ; 100     0   16
         +  1979ms:               ; 100     0    3
     0: prio=normal sync=0 elapsed_ms=1015ms (ideal_ms=1000ms)
cycle_time(min,avg,max)=134,222,978 us latency_time(min,avg,max)=134,222,978
us
     1: prio=low sync=0 elapsed_ms=2009ms (ideal_ms=1000ms)
cycle_time(min,avg,max)=134,215,806 us latency_time(min,avg,max)=134,215,806 us

There we have two clients represented in the two respective columns, with
their progress logged roughly every 100 milliseconds. The metrics are:

  - pct - Percentage progress of the job submit part
  - cps - Cycles per second
  - qd  - Queue depth - number of submitted unfinished jobs

The cycles per second metric is inherent to the fact that workload
patterns are a data driven cycling sequence of:

  - Submit 1..N jobs
  - Wait for Nth job to finish (optional)
  - Sleep (optional)
  - Repeat from start

In this particular example we have a normal priority and a low priority
clients both spamming the scheduler with 8ms jobs with no sync and no
sleeping. Hence they build a very deep queues and we can see how the low
priority client is completely starved until the normal finishes.

Note that the PCT and CPS metrics are irrelevant for "unsync" clients
since they manage to complete all of their cycles instantaneously.

A different example would be:

   Heavy and interactive:
                     pct1 cps1 qd1;  pct2 cps2 qd2
         +     0ms:   0     0    0;   0     0    0
         +   106ms:   5    40    3;   5    40    0
         +   209ms:   9    40    0;   9    40    0
         +   314ms:  14    50    3;  14    50    0
         +   417ms:  18    40    0;  18    40    0
         +   522ms:  23    50    3;  23    50    0
         +   625ms:  27    40    0;  27    40    1
         +   729ms:  32    50    0;  32    50    0
         +   833ms:  36    40    1;  36    40    0
         +   937ms:  40    40    0;  40    40    0
         +  1041ms:  45    50    0;  45    50    0
         +  1146ms:  49    40    1;  49    40    1
         +  1249ms:  54    50    0;  54    50    0
         +  1353ms:  58    40    1;  58    40    0
         +  1457ms:  62    40    0;  62    40    1
         +  1561ms:  67    50    0;  67    50    0
         +  1665ms:  71    40    1;  71    40    0
         +  1772ms:  76    50    0;  76    50    0
         +  1877ms:  80    40    1;  80    40    0
         +  1981ms:  84    40    0;  84    40    0
         +  2085ms:  89    50    0;  89    50    0
         +  2189ms:  93    40    1;  93    40    0
         +  2293ms:  97    40    0;  97    40    1

In this case client one is submitting 3x 2.5ms jobs, waiting for the 3rd
and then sleeping for 2.5ms (in effect causing 75% GPU load, minus the
overheads). Second client is submitting 1ms jobs, waiting for each to
finish and sleeping for 9ms (effective 10% GPU load). Here we can see
the PCT and CPS reflecting real progress.

Signed-off-by: Tvrtko Ursulin <[email protected]>
Cc: Christian König <[email protected]>
Cc: Danilo Krummrich <[email protected]>
Cc: Matthew Brost <[email protected]>
Cc: Philipp Stanner <[email protected]>
Cc: Pierre-Eric Pelloux-Prayer <[email protected]>
Acked-by: Christian König <[email protected]>
---
  drivers/gpu/drm/scheduler/tests/Makefile      |   3 +-
  .../gpu/drm/scheduler/tests/tests_scheduler.c | 640 ++++++++++++++++++
  2 files changed, 642 insertions(+), 1 deletion(-)
  create mode 100644 drivers/gpu/drm/scheduler/tests/tests_scheduler.c

diff --git a/drivers/gpu/drm/scheduler/tests/Makefile
b/drivers/gpu/drm/scheduler/tests/Makefile
index 5bf707bad373..9ec185fbbc15 100644
--- a/drivers/gpu/drm/scheduler/tests/Makefile
+++ b/drivers/gpu/drm/scheduler/tests/Makefile
@@ -2,6 +2,7 @@
drm-sched-tests-y := \
          mock_scheduler.o \
-        tests_basic.o
+        tests_basic.o \
+        tests_scheduler.o
obj-$(CONFIG_DRM_SCHED_KUNIT_TEST) += drm-sched-tests.o
diff --git a/drivers/gpu/drm/scheduler/tests/tests_scheduler.c
b/drivers/gpu/drm/scheduler/tests/tests_scheduler.c
new file mode 100644
index 000000000000..15c898966ef0
--- /dev/null
+++ b/drivers/gpu/drm/scheduler/tests/tests_scheduler.c
@@ -0,0 +1,640 @@
+// SPDX-License-Identifier: GPL-2.0
+/* Copyright (c) 2025 Valve Corporation */
+
+#include <linux/delay.h>
+#include <linux/kthread.h>
+#include <linux/ktime.h>
+#include <linux/math64.h>
+
+#include "sched_tests.h"
+
+/*
+ * DRM scheduler scheduler tests exercise load balancing decisions ie. entity
+ * selection logic.
+ */
+
+static int drm_sched_scheduler_init(struct kunit *test)
+{
+       struct drm_mock_scheduler *sched;
+
+       sched = drm_mock_sched_new(test, MAX_SCHEDULE_TIMEOUT);
+       sched->base.credit_limit = 1;
+
+       test->priv = sched;
+
+       return 0;
+}
+
+static int drm_sched_scheduler_init2(struct kunit *test)
I'm not very convinced of the naming prefixes in this file. They're all
static, but people might find them through Bootlin or similar and be
confused.

in tests_basic.c we call all functions drm_sched_basic.

So I'd propose to go for drm_sched_quality here.
I don't think we should be that concerned about the names of private
functions as long as they are reasonable. I do use "quality" in the
patch title but I don't think that is the best term for describing the
whole group.
If I *have* to churn I would suggest drm_sched_scheduling (and
tests_scheduling). Because as you say, tests_basic -> drm_sched_basic_
and tests_scheduler -> drm_sched_scheduler_.
+{
+       struct drm_mock_scheduler *sched;
+
+       sched = drm_mock_sched_new(test, MAX_SCHEDULE_TIMEOUT);
+       sched->base.credit_limit = 2;
+
+       test->priv = sched;
+
+       return 0;
+}
+
+static void drm_sched_scheduler_exit(struct kunit *test)
+{
+       struct drm_mock_scheduler *sched = test->priv;
+
+       drm_mock_sched_fini(sched);
+}
+
+static void drm_sched_scheduler_queue_overhead(struct kunit *test)
What queue's overhead is this, actually? Seems to me that it's more the
scheduler overhead for processing jobs in general.
Queue of jobs submitted to the scheduler, and the overhead of scheduler
processing that queue.
+{
+       struct drm_mock_scheduler *sched = test->priv;
+       struct drm_mock_sched_entity *entity;
+       const unsigned int job_us = 1000;
+       const unsigned int jobs = 1000;
+       const unsigned int total_us = jobs * job_us;
+       struct drm_mock_sched_job *job, *first;
+       ktime_t start, end;
+       bool done;
+       int i;
+
+       /*
+        * Deep queue job at a time processing (single credit).
"Measure job-by-job processing overhead time"?
Almost literally written below.
+        *
+        * This measures the overhead of picking and processing a job at a time
+        * by comparing the ideal total "GPU" time of all submitted jobs versus
+        * the time actually taken.
+        */
+
+       KUNIT_ASSERT_EQ(test, sched->base.credit_limit, 1);
+
+       entity = drm_mock_sched_entity_new(test,
+                                          DRM_SCHED_PRIORITY_NORMAL,
+                                          sched);
+
+       for (i = 0; i <= jobs; i++) {
+               job = drm_mock_sched_job_new(test, entity);
+               if (i == 0)
+                       first = job; /* Extra first job blocks the queue */
"Extra"?
Extra as in different from the rest of the queue. Not part of the job
count as specified in test prologue.
+               else
+                       drm_mock_sched_job_set_duration_us(job, job_us);
+               drm_mock_sched_job_submit(job);
+       }
+
+       done = drm_mock_sched_job_wait_scheduled(first, HZ);
+       KUNIT_ASSERT_TRUE(test, done);
+
+       start = ktime_get();
+       i = drm_mock_sched_advance(sched, 1); /* Release the queue */
+       KUNIT_ASSERT_EQ(test, i, 1);
+
+       done = drm_mock_sched_job_wait_finished(job,
+                                               usecs_to_jiffies(total_us) * 5);
Why 5?
Arbitrary long enough wait since the test is not setting a pass-fail
criteria but expecting to finish and just log the result.
+       end = ktime_get();
+       KUNIT_ASSERT_TRUE(test, done);
+
+       pr_info("Expected %uus, actual %lldus\n",
+               total_us,
+               ktime_to_us(ktime_sub(end, start)));
+
+       drm_mock_sched_entity_free(entity);
+}
+
+static void drm_sched_scheduler_ping_pong(struct kunit *test)
Interesting idea for a test!
:) It's really rudimentary. You should take a peek at the i915 tests we
have written over the years.
+{
+       struct drm_mock_sched_job *job, *first, *prev = NULL;
+       struct drm_mock_scheduler *sched = test->priv;
+       struct drm_mock_sched_entity *entity[2];
Setting a define saves you the ARRAY_SIZE. But I don't have a strong
opinion on that.
+       const unsigned int job_us = 1000;
+       const unsigned int jobs = 1000;
+       const unsigned int total_us = jobs * job_us;
+       ktime_t start, end;
+       bool done;
+       int i;
+
+       /*
+        * Two entitites in inter-dependency chain.
+        *
+        * This measures the overhead of picking and processing a job at a time,
+        * where each job depends on the previous one from the diffferent
+        * entity, by comparing the ideal total "GPU" time of all submitted jobs
+        * versus the time actually taken.
+        */
+
+       KUNIT_ASSERT_EQ(test, sched->base.credit_limit, 1);
+
+       for (i = 0; i < ARRAY_SIZE(entity); i++)
+               entity[i] = drm_mock_sched_entity_new(test,
+                                                     DRM_SCHED_PRIORITY_NORMAL,
+                                                     sched);
+
+       for (i = 0; i <= jobs; i++) {
+               job = drm_mock_sched_job_new(test, entity[i & 1]);
+               if (i == 0)
+                       first = job; /* Extra first job blocks the queue */
+               else
+                       drm_mock_sched_job_set_duration_us(job, job_us);
+               if (prev)
+                       drm_sched_job_add_dependency(&job->base,
+
dma_fence_get(&prev->base.s_fence->finished));
+               drm_mock_sched_job_submit(job);
+               prev = job;
+       }
+
+       done = drm_mock_sched_job_wait_scheduled(first, HZ);
+       KUNIT_ASSERT_TRUE(test, done);
+
+       start = ktime_get();
+       i = drm_mock_sched_advance(sched, 1); /* Release the queue */
+       KUNIT_ASSERT_EQ(test, i, 1);
+
+       done = drm_mock_sched_job_wait_finished(job,
+                                               usecs_to_jiffies(total_us) * 5);
Same. I guess 5 is just "long enough to be finished for sure".
+       end = ktime_get();
+       KUNIT_ASSERT_TRUE(test, done);
+
+       pr_info("Expected %uus, actual %lldus\n",
+               total_us,
+               ktime_to_us(ktime_sub(end, start)));
+
+       for (i = 0; i < ARRAY_SIZE(entity); i++)
+               drm_mock_sched_entity_free(entity[i]);
+}
+
+static struct kunit_case drm_sched_scheduler_overhead_tests[] = {
+       KUNIT_CASE_SLOW(drm_sched_scheduler_queue_overhead),
+       KUNIT_CASE_SLOW(drm_sched_scheduler_ping_pong),
+       {}
+};
+
+static struct kunit_suite drm_sched_scheduler_overhead = {
+       .name = "drm_sched_scheduler_overhead_tests",
+       .init = drm_sched_scheduler_init,
+       .exit = drm_sched_scheduler_exit,
+       .test_cases = drm_sched_scheduler_overhead_tests,
+};
+
+struct drm_sched_client_params {
+       enum drm_sched_priority priority;
+       unsigned int job_cnt;
+       unsigned int job_us;
+       unsigned int wait_us;
+       bool sync;
+};
Struct documentation would be neat. cnt is obvious.. job_us is the
"payload time" and "wait_us" is.. the time you wait until submitting a
job? And sync is whether you submit synchronously? Doesn't that then
imply wait_us == 0?
Wait_us is time client waits before starting the next loop. Sync is if
it waits for the previous loop to finish on the "GPU". They are
independent and useful for simulating some basic submission patterns.
As a side note, this builds upon my experience from IGT/gem_wsim^1. It
is i915 focused and not interesting or used much these days. But it was
instrumental for making sure various datacenter media transcode
workloads run well.
Not least, recently AMD reported^2 scheduler latencies can slow down
similar workloads on their hardware. Which on the overall means making
sure scheduler has low overheads and handles things like ping-pong queue
transitions well are relevant.
1)
https://cgit.freedesktop.org/drm/igt-gpu-tools/tree/benchmarks/wsim/README

2)
https://lore.kernel.org/amd-gfx/[email protected]/
I'm reading as I write; I guess it gets clearer below. But you get the
point, a few words of docu would help new programmers / reviewers.
Makes sense to document it here. Will add.
+
+struct drm_sched_test_params {
+       const char *description;
+       struct drm_sched_client_params client[2];
+};
+
+static const struct drm_sched_test_params drm_sched_cases[] = {
+       {
+               .description = "Normal and normal",
s/normal/normal prio/
It would be very verbose when applied to all tests for questionable
gain. Only scheduler experts will look at these tests so I think it is
preferrable to stay readable.
Anyway we can bikeshed later, I'll skip this block for now.
+               .client[0] = {
+                       .priority = DRM_SCHED_PRIORITY_NORMAL,
+                       .job_cnt = 1,
+                       .job_us = 8000,
+                       .wait_us = 0,
+                       .sync = false,
+               },
+               .client[1] = {
+                       .priority = DRM_SCHED_PRIORITY_NORMAL,
+                       .job_cnt = 1,
+                       .job_us = 8000,
+                       .wait_us = 0,
+                       .sync = false,
+               },
+       },
+       {
+               .description = "Normal and low",
+               .client[0] = {
+                       .priority = DRM_SCHED_PRIORITY_NORMAL,
+                       .job_cnt = 1,
+                       .job_us = 8000,
+                       .wait_us = 0,
+                       .sync = false,
+               },
+               .client[1] = {
+                       .priority = DRM_SCHED_PRIORITY_LOW,
+                       .job_cnt = 1,
+                       .job_us = 8000,
+                       .wait_us = 0,
+                       .sync = false,
+               },
+       },
+       {
+               .description = "High and normal",
+               .client[0] = {
+                       .priority = DRM_SCHED_PRIORITY_HIGH,
+                       .job_cnt = 1,
+                       .job_us = 8000,
+                       .wait_us = 0,
+                       .sync = false,
+               },
+               .client[1] = {
+                       .priority = DRM_SCHED_PRIORITY_NORMAL,
+                       .job_cnt = 1,
+                       .job_us = 8000,
+                       .wait_us = 0,
+                       .sync = false,
+               },
+       },
+       {
+               .description = "High and low",
+               .client[0] = {
+                       .priority = DRM_SCHED_PRIORITY_HIGH,
+                       .job_cnt = 1,
+                       .job_us = 8000,
+                       .wait_us = 0,
+                       .sync = false,
+               },
+               .client[1] = {
+                       .priority = DRM_SCHED_PRIORITY_LOW,
+                       .job_cnt = 1,
+                       .job_us = 8000,
+                       .wait_us = 0,
+                       .sync = false,
+               },
+       },
+       {
+               .description = "50 and 50",
Hm? 50 normal and 50 normal?
+               .client[0] = {
+                       .priority = DRM_SCHED_PRIORITY_NORMAL,
+                       .job_cnt = 1,
+                       .job_us = 1500,
+                       .wait_us = 1500,
+                       .sync = true,
+               },
+               .client[1] = {
+                       .priority = DRM_SCHED_PRIORITY_NORMAL,
+                       .job_cnt = 1,
+                       .job_us = 2500,
+                       .wait_us = 2500,
+                       .sync = true,
+               },
+       },
+       {
+               .description = "50 and 50 low",
+               .client[0] = {
+                       .priority = DRM_SCHED_PRIORITY_NORMAL,
+                       .job_cnt = 1,
+                       .job_us = 1500,
+                       .wait_us = 1500,
+                       .sync = true,
+               },
+               .client[1] = {
+                       .priority = DRM_SCHED_PRIORITY_LOW,
+                       .job_cnt = 1,
+                       .job_us = 2500,
+                       .wait_us = 2500,
+                       .sync = true,
+               },
+       },
+       {
+               .description = "50 high and 50",
+               .client[0] = {
+                       .priority = DRM_SCHED_PRIORITY_HIGH,
+                       .job_cnt = 1,
+                       .job_us = 1500,
+                       .wait_us = 1500,
+                       .sync = true,
+               },
+               .client[1] = {
+                       .priority = DRM_SCHED_PRIORITY_NORMAL,
+                       .job_cnt = 1,
+                       .job_us = 2500,
+                       .wait_us = 2500,
+                       .sync = true,
+               },
+       },
+       {
+               .description = "Low hog and interactive",
+               .client[0] = {
+                       .priority = DRM_SCHED_PRIORITY_LOW,
+                       .job_cnt = 3,
+                       .job_us = 2500,
+                       .wait_us = 500,
+                       .sync = false,
+               },
+               .client[1] = {
+                       .priority = DRM_SCHED_PRIORITY_NORMAL,
+                       .job_cnt = 1,
+                       .job_us = 500,
+                       .wait_us = 10000,
+                       .sync = true,
+               },
+       },
+       {
+               .description = "Heavy and interactive",
+               .client[0] = {
+                       .priority = DRM_SCHED_PRIORITY_NORMAL,
+                       .job_cnt = 3,
+                       .job_us = 2500,
+                       .wait_us = 2500,
+                       .sync = true,
+               },
+               .client[1] = {
+                       .priority = DRM_SCHED_PRIORITY_NORMAL,
+                       .job_cnt = 1,
+                       .job_us = 1000,
+                       .wait_us = 9000,
+                       .sync = true,
+               },
+       },
+       {
+               .description = "Very heavy and interactive",
+               .client[0] = {
+                       .priority = DRM_SCHED_PRIORITY_NORMAL,
+                       .job_cnt = 4,
+                       .job_us = 50000,
+                       .wait_us = 1,
+                       .sync = true,
+               },
+               .client[1] = {
+                       .priority = DRM_SCHED_PRIORITY_NORMAL,
+                       .job_cnt = 1,
+                       .job_us = 1000,
+                       .wait_us = 9000,
+                       .sync = true,
+               },
+       },
+};
+
+static void
+drm_sched_desc(const struct drm_sched_test_params *params, char *desc)
+{
+       strscpy(desc, params->description, KUNIT_PARAM_DESC_SIZE);
+}
+
+KUNIT_ARRAY_PARAM(drm_sched_scheduler_two_clients,
+                 drm_sched_cases,
+                 drm_sched_desc);
+
+struct test_client_stats {
+       unsigned int min_us;
+       unsigned int max_us;
+       unsigned long tot_us;
+};
+
+struct test_client {
+       struct kunit *test;
+
+       struct drm_mock_sched_entity    *entity;
+
+       struct kthread_worker   *worker;
+       struct kthread_work     work;
+
+       unsigned int id;
+       ktime_t duration;
+
+       struct drm_sched_client_params params;
+
+       ktime_t ideal_duration;
+       unsigned int cycles;
+       unsigned int cycle;
+       ktime_t start;
+       ktime_t end;
+       bool done;
+
+       struct test_client_stats cycle_time;
+       struct test_client_stats latency_time;
+};
Same here, docu would be helpful. Especially regarding "cycles". It
seems to be "cycles per second", if I read the code below correctly.
No, cycles per second is a different metric emitted for each client.

I will document because it does make some sense to do it.
+
+static void
+update_stats(struct test_client_stats *stats, unsigned int us)
+{
+       if (us > stats->max_us)
+               stats->max_us = us;
+       if (us < stats->min_us)
Won't min_us be initialized to 0? So how could 'us' ever be smaller?
No, it is the usual pattern:

 max = 0
 min = ~0
+               stats->min_us = us;
+       stats->tot_us += us;
+}
+
+static unsigned int
+get_stats_avg(struct test_client_stats *stats, unsigned int cycles)
+{
+       return div_u64(stats->tot_us, cycles);
+}
+
+static void drm_sched_client_work(struct kthread_work *work)
Why's this called "client_work"? Is it representing the userspace
client?
Yep.
+{
+       struct test_client *client = container_of(work, typeof(*client), work);
+       const long sync_wait = MAX_SCHEDULE_TIMEOUT;
+       unsigned int cycle, work_us, period_us;
+       struct drm_mock_sched_job *job = NULL;
+
+       work_us = client->params.job_cnt * client->params.job_us;
+       period_us = work_us + client->params.wait_us;
+       client->cycles =
+               DIV_ROUND_UP((unsigned int)ktime_to_us(client->duration),
+                            period_us);
+       client->ideal_duration = us_to_ktime(client->cycles * period_us);
+
+       client->start = ktime_get();
+
+       for (cycle = 0; cycle < client->cycles; cycle++) {
+               unsigned int batch;
+               unsigned long us;
+               ktime_t t;
't' is used at a couple of places below, including when firing the
WARN_ON_ONCE. I think the name should reveal more clearly what time is
actually measured here, so that it gets more obvious for what
conditions you're checking below.
Makes sense.
+
+               if (READ_ONCE(client->done))
+                       break;
+
+               t = ktime_get();
+               for (batch = 0; batch < client->params.job_cnt; batch++) {
+                       job = drm_mock_sched_job_new(client->test,
+                                                    client->entity);
+                       drm_mock_sched_job_set_duration_us(job,
+
client->params.job_us);
+                       drm_mock_sched_job_submit(job);
+               }
+
+               if (client->params.sync)
+                       drm_mock_sched_job_wait_finished(job, sync_wait);
+
+               t = ktime_sub(ktime_get(), t);
+               us = ktime_to_us(t);
+               update_stats(&client->cycle_time, us);
+               if (ktime_to_us(t) >= (long)work_us)
+                       us = ktime_to_us(t) - work_us;
+               else if (WARN_ON_ONCE(client->params.sync))
See above. For me as a new reader it reads like this:

"if it did not take longer than it should have taken, and if this is
synchronous, then that's a bug"
If the GPU job took less than it was configured to take, _and_ we waited
for it to finish, then it is a bug in the mock scheduler which makes
testing invalid and should be looked at. Will add a comment.
+                       us = 0;
+               update_stats(&client->latency_time, us);
+               WRITE_ONCE(client->cycle, cycle);
+
+               if (READ_ONCE(client->done))
+                       break;
+
+               if (client->params.wait_us)
+                       fsleep(client->params.wait_us);
+               else
+                       cond_resched();
This if-else definitely needs a comment explaining what is being done
and why. Why do you volunteer the CPU here? The function is about to
end anyways.
It is a loop so it may not end. Cond_resched() is just so the thread
does not hog the CPU completely if submitting a huge number of jobs on a
slow machine and with neither sync or wait_us set. Will add a comment.
+       }
+
+       client->done = drm_mock_sched_job_wait_finished(job, sync_wait);
+       client->end = ktime_get();
+}
+
+static const char *prio_str(enum drm_sched_priority prio)
+{
+       switch (prio) {
+       case DRM_SCHED_PRIORITY_KERNEL:
+               return "kernel";
+       case DRM_SCHED_PRIORITY_LOW:
+               return "low";
+       case DRM_SCHED_PRIORITY_NORMAL:
+               return "normal";
+       case DRM_SCHED_PRIORITY_HIGH:
+               return "high";
+       default:
+               return "???";
s/???/INVALID
:shrug:
+       }
+}
+
+static void drm_sched_scheduler_two_clients_test(struct kunit *test)
+{
+       const struct drm_sched_test_params *params = test->param_value;
+       struct drm_mock_scheduler *sched = test->priv;
+       struct test_client client[2] = { };
+       unsigned int prev_cycle[2] = { };
+       unsigned int i, j;
+       ktime_t start;
+
+       /*
+        * Same job stream from from two clients.
Typo, "from from"
Marking as TODO.
btw it's not super clear what's being tested here by the description /
names alone. You did test with two entities above in the ping-pong
example already. So I suppose a "client" is a party owning multiple
entities?
Client is simulating an userspace client submitting GPU work. Two
clients means two of those running in parallel. See comment a bit lower
in this function. That one also explains the client work definition data
structure a bit.
+        */
+
+       for (i = 0; i < ARRAY_SIZE(client); i++)
+               client[i].entity =
+                       drm_mock_sched_entity_new(test,
+                                                 params->client[i].priority,
+                                                 sched);
+
+       for (i = 0; i < ARRAY_SIZE(client); i++) {
+               client[i].test = test;
+               client[i].id = i;
+               client[i].duration = ms_to_ktime(1000);
+               client[i].params = params->client[i];
+               client[i].cycle_time.min_us = ~0U;
+               client[i].latency_time.min_us = ~0U;
+               client[i].worker =
+                       kthread_create_worker(0, "%s-%u", __func__, i);
+               if (IS_ERR(client[i].worker)) {
+                       for (j = 0; j < i; j++)
+                               kthread_destroy_worker(client[j].worker);
+                       KUNIT_FAIL(test, "Failed to create worker!\n");
+               }
+
+               kthread_init_work(&client[i].work, drm_sched_client_work);
+       }
+
+       for (i = 0; i < ARRAY_SIZE(client); i++)
+               kthread_queue_work(client[i].worker, &client[i].work);
+
+       /*
+        * The clients (workers) can be a mix of async (deep submission queue),
+        * sync (one job at a time), or something in between. Therefore it is
+        * difficult to display a single metric representing their progress.
+        *
+        * Each struct drm_sched_client_params describes the actual submission
+        * pattern which happens in the following steps:
+        *  1. Submit N jobs
+        *  2. Wait for last submitted job to finish
+        *  3. Sleep for U micro-seconds
+        *  4. Goto 1. for C cycles
OK, so this is simulating clients submitting in a burst-like pattern.
Could it make sense to name the test something with "burst"?
No, it doesn't have to be burst. Same loop is executing all the workload
patterns define in drm_sched_cases[]. Each of those has a name and
submission pattern definition for two clients.
Take for example "Very heavy and interactive":

        {
                .description = "Very heavy and interactive",
                .client[0] = {
                        .priority = DRM_SCHED_PRIORITY_NORMAL,
                        .job_cnt = 4,
                        .job_us = 50000,
                        .wait_us = 1,
                        .sync = true,
                },
                .client[1] = {
                        .priority = DRM_SCHED_PRIORITY_NORMAL,
                        .job_cnt = 1,
                        .job_us = 1000,
                        .wait_us = 9000,
                        .sync = true,
                },
        },
That was roughly modeled on one medical imaging use case Pierre-Eric saw
works really badly with the current scheduler.
1)
Medical imaging sofware submits a series of very demanding jobs. It
waits not that much between them: 4x 50ms jobs, wait gor them to finish,
sleep 1us, repeat.
2)
You try to use some light GUI application in parallel: 1x 1ms job, wait
for it to finish, sleep for 9ms (imagine that's waiting for the next vsync).
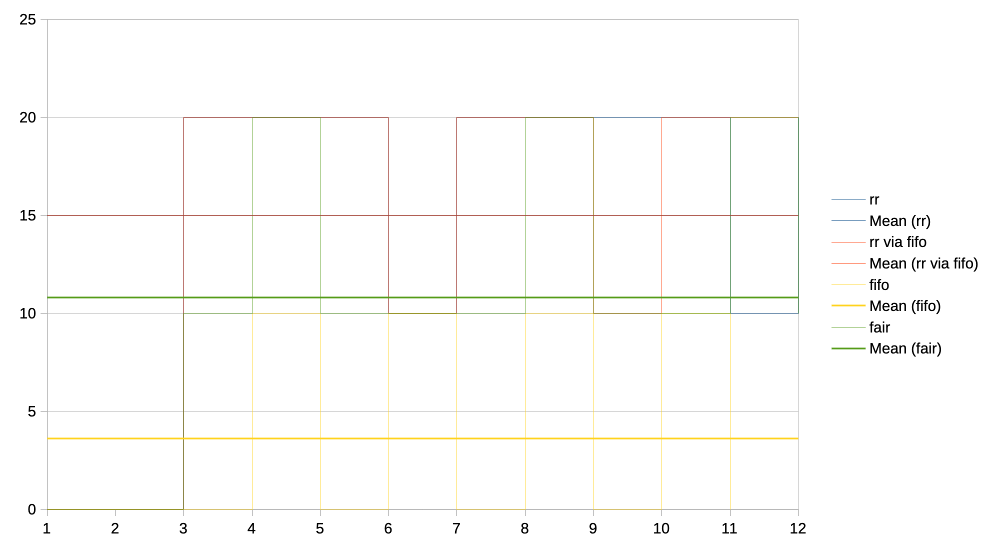
This workload runs horribly with the FIFO scheduler:

https://people.igalia.com/tursulin/drm-sched-fair/4-very-heavy-vs-interactive.png
The graph is showing the "FPS" of the 2nd client (the lightweight
interactive one) over the test runtime, for different scheduling algorithms.
+        *
+        * Where number of cycles is calculated to match the target client
+        * duration from the respective struct drm_sched_test_params.
+        *
+        * To asses scheduling behaviour what we output for both clients is:
+        *  - pct: Percentage progress of the jobs submitted
+        *  - cps: "Cycles" per second (where one cycle is one 1.-4. above)
"is one complete submission pattern from the list above"
Ok.
+        *  -  qd: Number of outstanding jobs in the client/entity
+        */
+
+       start = ktime_get();
+       pr_info("%s:\n\t            pct1 cps1 qd1;  pct2 cps2 qd2\n",
+               params->description);
+       while (!READ_ONCE(client[0].done) || !READ_ONCE(client[1].done)) {
You probably want write in the documentation of struct test_client what
'done' does and who sets and reads it. Then it becomes more obvious why
a READ_ONCE is necessary.
Okay. I can even make it a helper so it will be even clearer.
+               unsigned int pct[2], qd[2], cycle[2], cps[2];
+
+               for (i = 0; i < ARRAY_SIZE(client); i++) {
+                       qd[i] =
spsc_queue_count(&client[i].entity->base.job_queue);
+                       cycle[i] = READ_ONCE(client[i].cycle);
+                       cps[i] = DIV_ROUND_UP(1000 * (cycle[i] - prev_cycle[i]),
Now you've lost me. All numbers so far always were microseconds (us).
To get the cycles per second, don't you have to multiply by 1,000,000?
Extra 10 is the 10 Hz logging period. I need to move the period into a
local const, then it will be self-documenting.
+                                             100);
+                       if (client[i].cycles)
+                               pct[i] = DIV_ROUND_UP(100 * (1 + cycle[i]),
Why 100 (here and above) and why +1?
100 is to calculate a percentage value of current cycle / total cycles.
IIRC +1 is to reach 100% when last cycle is total cycles - 1. So just
for prettier output.
Regards,

Tvrtko
--

I want to go through the other patches this week, too. I guess I'll get
up to speed with the code better in general.


P.
+                                                     client[i].cycles);
+                       else
+                               pct[i] = 0;
+                       prev_cycle[i] = cycle[i];
+               }
+
+               if (READ_ONCE(client[0].done))
+                       pr_info("\t+%6lldms:               ; %3u %5u %4u\n",
+                               ktime_to_ms(ktime_sub(ktime_get(), start)),
+                               pct[1], cps[1], qd[1]);
+               else if (READ_ONCE(client[1].done))
+                       pr_info("\t+%6lldms: %3u %5u %4u;\n",
+                               ktime_to_ms(ktime_sub(ktime_get(), start)),
+                               pct[0], cps[0], qd[0]);
+               else
+                       pr_info("\t+%6lldms: %3u %5u %4u; %3u %5u %4u\n",
+                               ktime_to_ms(ktime_sub(ktime_get(), start)),
+                               pct[0], cps[0], qd[0],
+                               pct[1], cps[1], qd[1]);
+               msleep(100);
+       }
+
+       for (i = 0; i < ARRAY_SIZE(client); i++) {
+               kthread_flush_work(&client[i].work);
+               kthread_destroy_worker(client[i].worker);
+       }
+
+       for (i = 0; i < ARRAY_SIZE(client); i++)
+               KUNIT_ASSERT_TRUE(test, client[i].done);
+
+       for (i = 0; i < ARRAY_SIZE(client); i++) {
+               pr_info("    %u: prio=%s sync=%u elapsed_ms=%lldms (ideal_ms=%lldms)
cycle_time(min,avg,max)=%u,%u,%u us latency_time(min,avg,max)=%u,%u,%u us",
+                       i,
+                       prio_str(params->client[i].priority),
+                       params->client[i].sync,
+                       ktime_to_ms(ktime_sub(client[i].end, client[i].start)),
+                       ktime_to_ms(client[i].ideal_duration),
+                       client[i].cycle_time.min_us,
+                       get_stats_avg(&client[i].cycle_time, client[i].cycles),
+                       client[i].cycle_time.max_us,
+                       client[i].latency_time.min_us,
+                       get_stats_avg(&client[i].latency_time,
client[i].cycles),
+                       client[i].latency_time.max_us);
+               drm_mock_sched_entity_free(client[i].entity);
+       }
+}
+
+static const struct kunit_attributes drm_sched_scheduler_two_clients_attr = {
+       .speed = KUNIT_SPEED_SLOW,
+};
+
+static struct kunit_case drm_sched_scheduler_two_clients_tests[] = {
+       KUNIT_CASE_PARAM_ATTR(drm_sched_scheduler_two_clients_test,
+                             drm_sched_scheduler_two_clients_gen_params,
+                             drm_sched_scheduler_two_clients_attr),
+       {}
+};
+
+static struct kunit_suite drm_sched_scheduler_two_clients1 = {
+       .name = "drm_sched_scheduler_two_clients_one_credit_tests",
+       .init = drm_sched_scheduler_init,
+       .exit = drm_sched_scheduler_exit,
+       .test_cases = drm_sched_scheduler_two_clients_tests,
+};
+
+static struct kunit_suite drm_sched_scheduler_two_clients2 = {
+       .name = "drm_sched_scheduler_two_clients_two_credits_tests",
+       .init = drm_sched_scheduler_init2,
+       .exit = drm_sched_scheduler_exit,
+       .test_cases = drm_sched_scheduler_two_clients_tests,
+};
+
+kunit_test_suites(&drm_sched_scheduler_overhead,
+                 &drm_sched_scheduler_two_clients1,
+                 &drm_sched_scheduler_two_clients2);