What I meant is that for small denominators (i.e. weak data, i.e. high
resolution), Rmerge is a quantity that does not have a statistically
meaningful average.
As James Holton pointed out before (can't find the original post, but
see links below):
Rmerge is (like?) a Cauchy distribution (check Wikipedia), which means
that regardless of how high your multiplicty, if the numbers you are
merging are near zero, Rmerge will not converge but jump around randomly
depending on which subset of reflections you use.
i.e. there is no way of knowing whether the data giving Rmerge 120% are
better or worse than those giving 90% or those giving 400%.
Ergo, don't bother reporting it, it don't tell you nuthin'.

(Rmeas has the same problem.)
CC* on the other hand - YES! Are people now putting that in their Table
1? When will we start...?
phx
(ccp4bb thread from January 2012: "Reasoning for Rmeas or Rpim as
Cutoff",
https://www.jiscmail.ac.uk/cgi-bin/webadmin?A1=ind1201&L=ccp4bb#135)
Quoting James on Rmerge vs I/sigI (I suspect he won't mind me reposting):
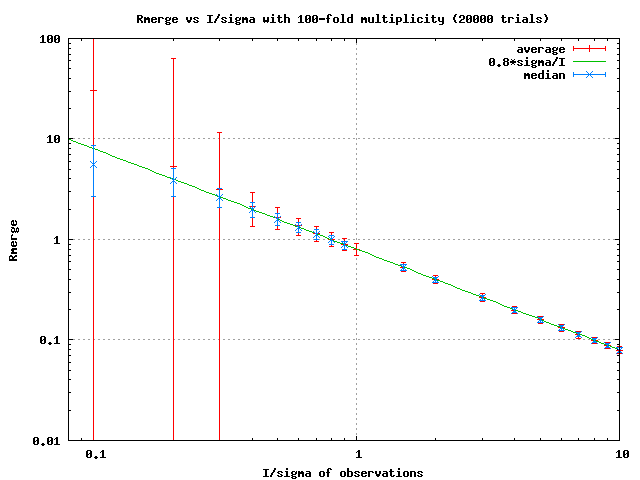
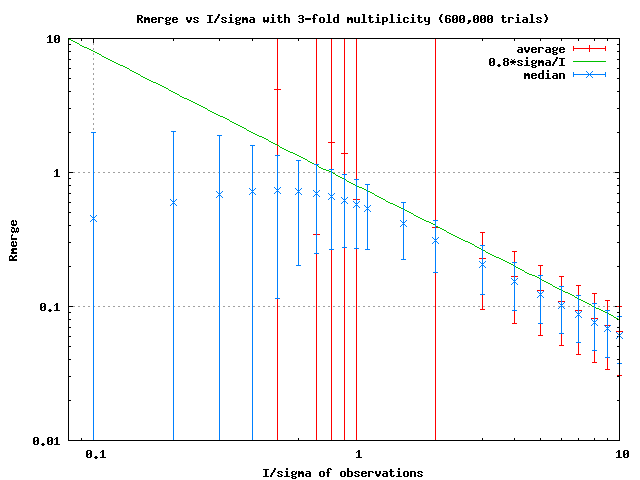
Do you mean these graphs?:
http://bl831.als.lbl.gov/~jamesh/pickup/Rmerge_avg_vs_median_m=100.png
http://bl831.als.lbl.gov/~jamesh/pickup/Rmerge_avg_vs_median_m=3.png
The x axis is the actual signal/noise ratio of a collection of
(either 3 or 100) "observations" and the left Y axis is the average
value of Rmerge from something like 20,000 independent attempts.
That is, you generate 100 "observations", compute Rmerge, and then
   do that 20,000 times and see what the average value of Rmerge is
   across all those attempts.  The RMS variation of all the "Rmerge"
   values obtained this way is the error bar. You can see that the
   error bars get huge, for low I/sigma.  Now, in the real world you
   only get one value of Rmerge for a given dataset, so what the big
   error bars mean is that this one value of Rmerge is basically a
   random number.  Doesn't really carry any information.  The blue
   error bars are the median Rmerge, which reflects how the median is a
   more stable statistic than an RMS for weird distributions (like the
   one Rmerge adopts at low I/sigma). However, this is not really
   useful, since you do only get one Rmerge per dataset.


On 15/08/2013 06:31, Edward A. Berry wrote:
But it is highly unlikely that sum(I) in the denominator is zero if
I/sig(I) is 2 as reported (providing the sig(I) is valid- what was
chi^2 in the last shell and overall?).
I sort of disagree that R-merge values over 1.0 are meaningless,
provided not too far over. Granted R-meas is more meaningful, but with
high redundancy R-merge approximates R-meas, and R-merge is what the
PDB is accepting now. A value a little over 1 tells you the standard
deviation of the individual mesurements is a little larger than the
average signal in those measurements. Understanding a little about
distribution of intensities and error propogation (standard error of
the mean, R-pim) the user will understand that quite a few reflections
were stronger than this standard deviation, and that the error in the
averaged intensities is be less than this standard deviation, and not
have a problem. The problem comes with the "100%-sum" mentality which
says that if your error is 100% the signal must be zero%. That is why
I don't like to express R-whatever as a percent. If the signal was
really zero, R-merge or R-meas would be plus/minus infinity. So much
for 100%-sum.
So rerun scalepack with "no merge original index", reprocess through
CCp4 or just rune Diedrich's "rmerge" program or
phenix.merging_statistics to get the value of r-merge (and r-meas and
R-pim and cc1/2) from the .sca file. If it is much over 3 than I would
rexamine the I/sig(I) value (which "can be misestimated") and consider
discarding the last shell. If it is 3 or less, report it. The PDB
ADDIT2 application used to not accept values over .99, but you can put
that and ask the friendly annotator to correct it in the final PDB
file. If the annotator objects, THEN point (him) to the 2012 K&D
paper- R-meas in the last shell there was over 4, and they concluded
there was useful information.
Of course by then you will have refined your structure, and unbiased
R-free in the last shell can be a good indicator. If you refine once
in phenix you can use phenix.cc_star to calculate cc* and compare with
R and R-free; from the output mtz file and your unmerged .sca file.
eab

Frank von Delft wrote:
This HKL2000 (scalepack) feature is actually extremely sensible: an
Rmerge that high is mathematically meaningless, it
quite literally tells you nothing at all about he signal in your data.

So I second James's advice:  just put "n/a" in your table 1.
If the reviewer complains, point them to Karplus & Diederichs,
Science, 2012, and Evans and Murshudov, ActaD, 2013, and
tell them to join us in the 21st century.


On 14/08/2013 16:41, Jeffrey, Philip D. wrote:
Hello Yafang,
The answer lies in the fact that you used HKL2000. Scalepack has a
long standing "feature" where it reports Rmerge >
100% as zero. Quite why they do that is a mystery, but your Rmerge
in the outermost shell is NOT zero - the Rmerge
for the lower resolution shells will show up as non-zero if Rmerge <
100%.
That feature is overdue for a fix.
Alternatively export your scaled data with NO MERGE ORIGINAL INDEX
and import into CCP4 via Pointless and have Scala
or Aimless report the correct statistics. Reprocessing the data
using XDS or Mosflm will ultimately lead you to
scaling the data with a program that doesn't have that bug. If you
do this, report Rmeas rather than Rmerge, the
former being a better measure.

Phil Jeffrey
Princeton
------------------------------------------------------------------------------------------------------------------------
*From:* CCP4 bulletin board [[email protected]] on behalf of
Yafang Chen [[email protected]]
*Sent:* Wednesday, August 14, 2013 11:32 AM
*To:* [email protected]
*Subject:* Re: [ccp4bb] Rmerge of the last shell is zero

Dear All,
Here are some more details about the question I asked earlier about
"Rmerge is 0 in the last shell". I processed the
data using HKL2000. The space group is I213. Redundancy is 10.2
(10.3). I/sigma is 34.8 (2.3). Rmerge is 6.5 (0.0).
Since I/sigmaI is more than 2 in the last shell, I preferred not to
cut back the resolution any more. But I don't know
how to explain Rmerge in the last shell being 0. Besides, I am
wondering if this data is publishable (with Rmerge
being 0 in the last shell). Thank you so much for your help!

Best,
Yafang
On Wed, Aug 14, 2013 at 10:59 AM, Yafang Chen
<[email protected] <mailto:[email protected]>> wrote:
Dear All,
I recently processed a dataset, in which I/sigmaI of the last
shell is 2.3, while Rmerge of the last shell is 0.
Does anyone know why the Rmerge is 0? The completeness is 100
(100). Thank you so much for your help in advance!
    Best,
    Yafang

    --
    Yafang Chen
    Graduate Research Assistant
    Mesecar Lab
    Department of Biological Sciences
    Purdue University
    Hockmeyer Hall of Structural Biology
    240 S. Martin Jischke Drive
    West Lafayette, IN 47907


--
Yafang Chen
Graduate Research Assistant
Mesecar Lab
Department of Biological Sciences
Purdue University
Hockmeyer Hall of Structural Biology
240 S. Martin Jischke Drive
West Lafayette, IN 47907