Hi all,

Sorry for this long tedious post.
I'm investigating fabric drops on a C6k switch. I see data that
confuses me and it's my hope that someone else have gone through
similar troubleshooting with more success. :-)

It's a C6509-V-E chassis with a single Sup2T (non-XL). Fabric drops are
occurring even though the fabric utlization doesn't seem all that high,
though measuring this precisely is difficult.

I have the following modules:

Mod Ports Card Type                              Model
--- ----- -------------------------------------- ------------------
  1   48  CEF720 48 port 10/100/1000mb Ethernet  WS-X6748-GE-TX
  2   48  CEF720 48 port 10/100/1000mb Ethernet  WS-X6748-GE-TX
  4   24  CEF720 24 port 1000mb SFP              WS-X6724-SFP
  5    5  Supervisor Engine 2T 10GE w/ CTS (Acti VS-SUP2T-10G
  8   20  DCEF2T 4 port 40GE / 16 port 10GE      C6800-16P10G
  9   20  DCEF2T 4 port 40GE / 16 port 10GE      WS-X6904-40G

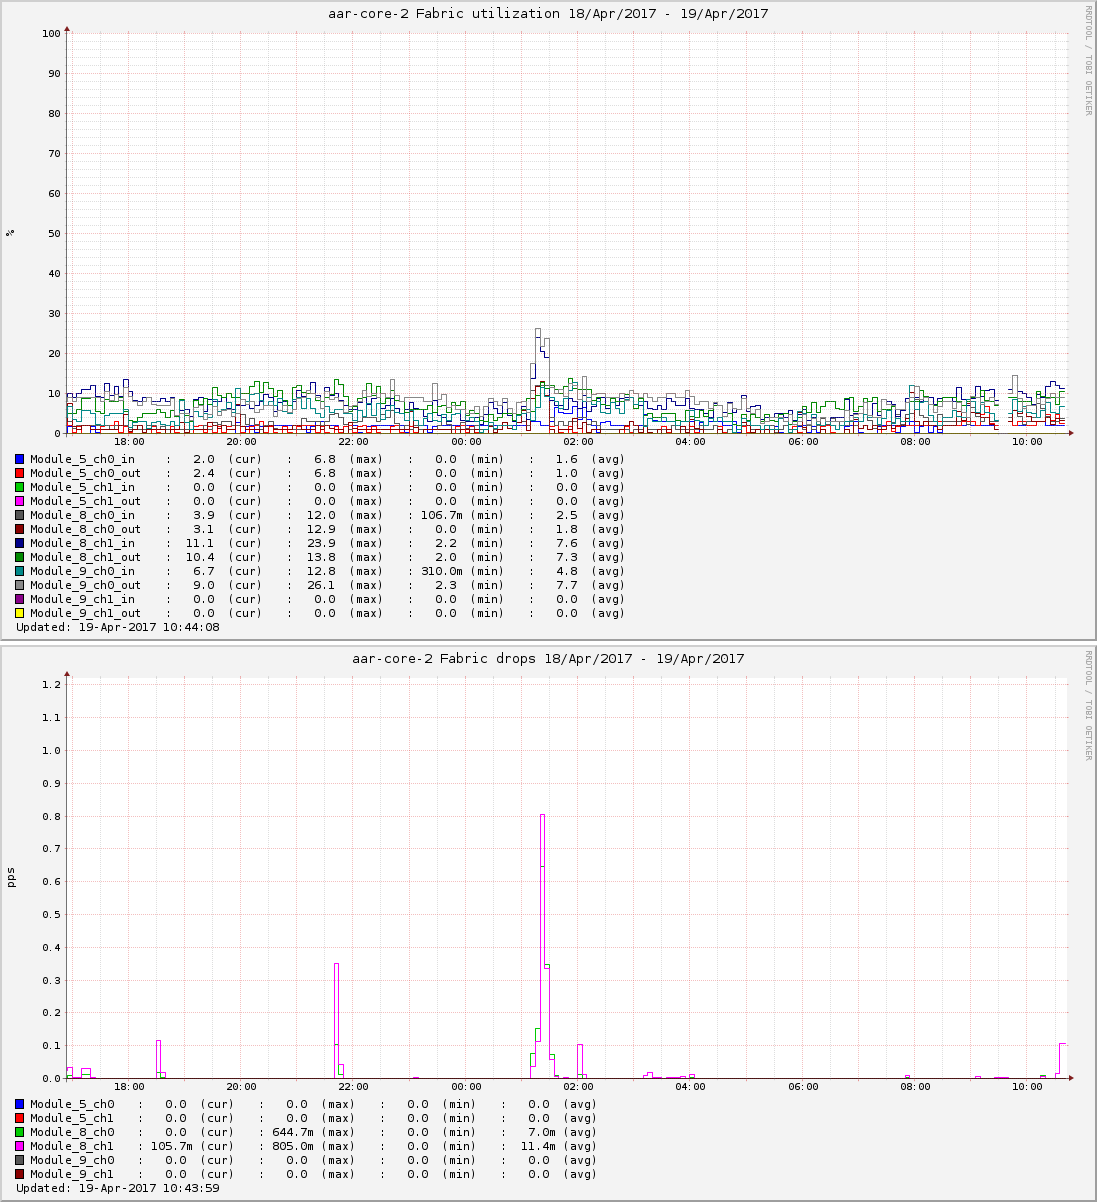
I see fabric drops inbound from module 8, both channels. We're RRD-
graphing these and the last ~18 hours util/drops show the following:

https://ampere.rathlev.dk/C6k-fabric-drops-20170419.png

The graph inputs are from scraping of "show fabric utilization" (GAUGE)
and "show fabric drop" (DERIVE).

The utilization is difficult to graph since "show fabric utilization"
returns the exact utilization at command invocation with no averaging.
Looking at "show fabric utilization detail" I can see that peak load
(not recently) for module 8 channel 0/1 was 23%/59% ingress and 25%/39%
egress, so the fabric utilization should have stayed at least below
these numbers for the graphed interval. But I still see drops. (All
drops are Low-Q-drops by the way, all High-Q-drop counters are 0.)

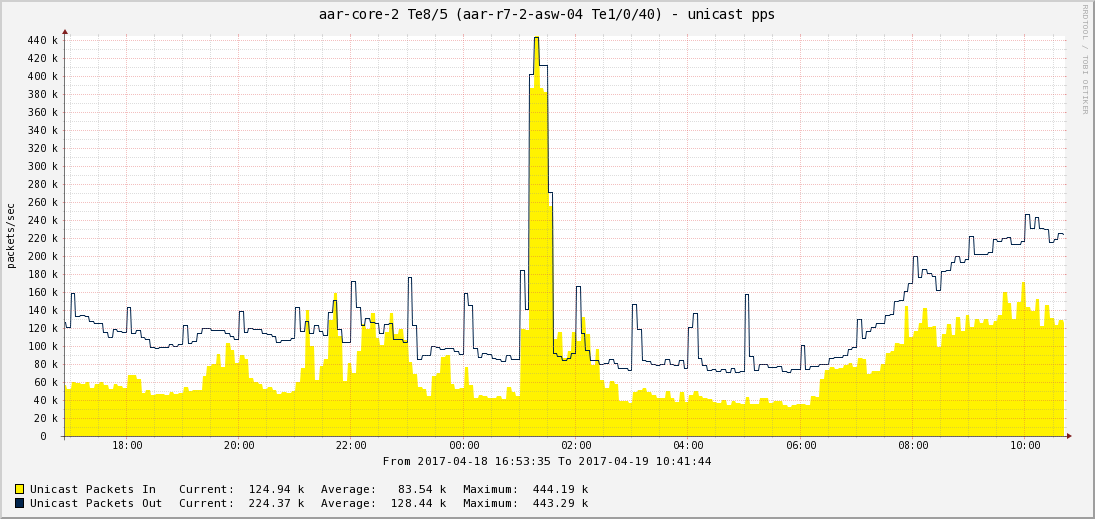
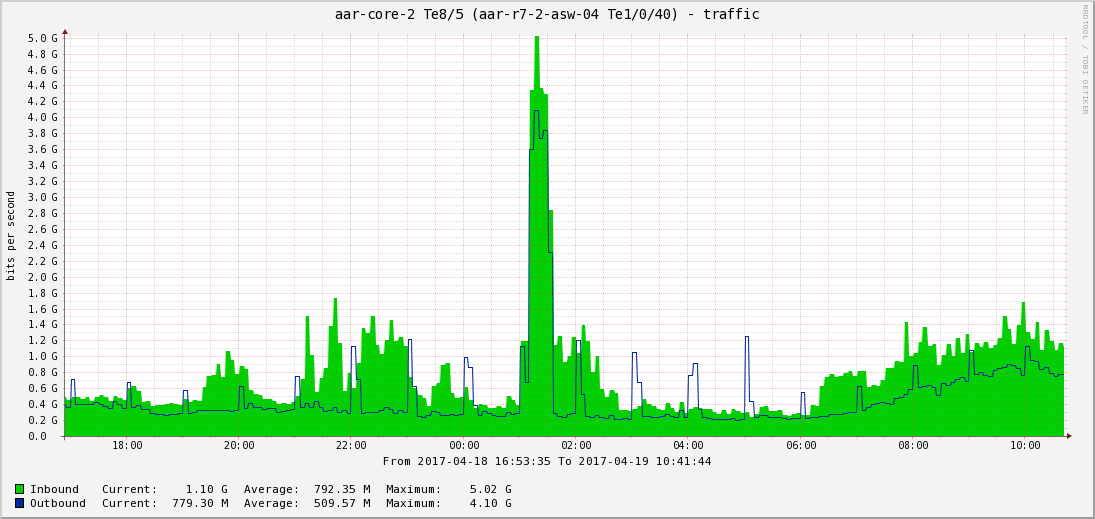
The drops (and slightly higher utilization) coincide with load on a
specific interface on module 8:

https://ampere.rathlev.dk/C6k-C6800-16p-interface-load-pps-20170419.png
https://ampere.rathlev.dk/C6k-C6800-16p-interface-load-bps-20170419.png

This traffic is MTU sized (1500B) IBM TSM based backup. The traffic
flows to/from an interface on module 9, hence the higher utilization on
modules 8 and 9. (Most of the traffic is between to VLANs which makes
the graph more symmetric.)

The fabric channels of both modules are 2 x 40G.

Furthermore: If I start a VLAN based local SPAN session, the number of
drops rise significantly. The rise in drops seems to follow the SPAN
session load, but even a few hundreds Mbps SPAN leads to drops. (A port
based local SPAN session does not lead to noticeable drops.) This makes
me curious but SPAN being what it is I'm not hoping for an explanation.

So my questions are something like:

 1) Can I trust the "peak utilization" numbers? Or are they also
    based on sampling and thus not able to see bursts?

 2) Are there PPS limits to the fabric channels? Or can I trust
    that the fabric can transport whatever I throw at it below
    BPS capacity? (This is 1500B packets, shouldn't be relevant.)

 3) Is there any way to know more about why packets are dropped?
    I'm guessing its similar to a "regular" interface dropping
    packets, e.g. lack of buffer space during high load. But with
    such a moderate utilization?

 4) Can anyone point at a detailed whitepaper for the C6800-16P10G
    module, similar to this on for the 6904 module:


http://www.cisco.com/c/en/us/products/collateral/switches/catalyst-6500-series-switches/white_paper_c11-696669.pdf

    Shortened URL: "http://goo.gl/s3Ndhg";. Something that shows
    internal bottlenecks and stuff like that.

 5) What could I do to alleviate the problem, apart from swapping
    interfaces so heave traffic stays on the same module? (This
    can be a bit of a puzzle.)

The "right" way to solve this is probably to swap the C6k with a Nexus
7000/7700, but I'd like to at least understand the problem better
first.

Any comments/help are much appreciated. :-)

--
Peter

_______________________________________________
cisco-nsp mailing list  [email protected]
https://puck.nether.net/mailman/listinfo/cisco-nsp
archive at http://puck.nether.net/pipermail/cisco-nsp/