match-gabeflores opened a new issue, #62935:
URL: https://github.com/apache/airflow/issues/62935
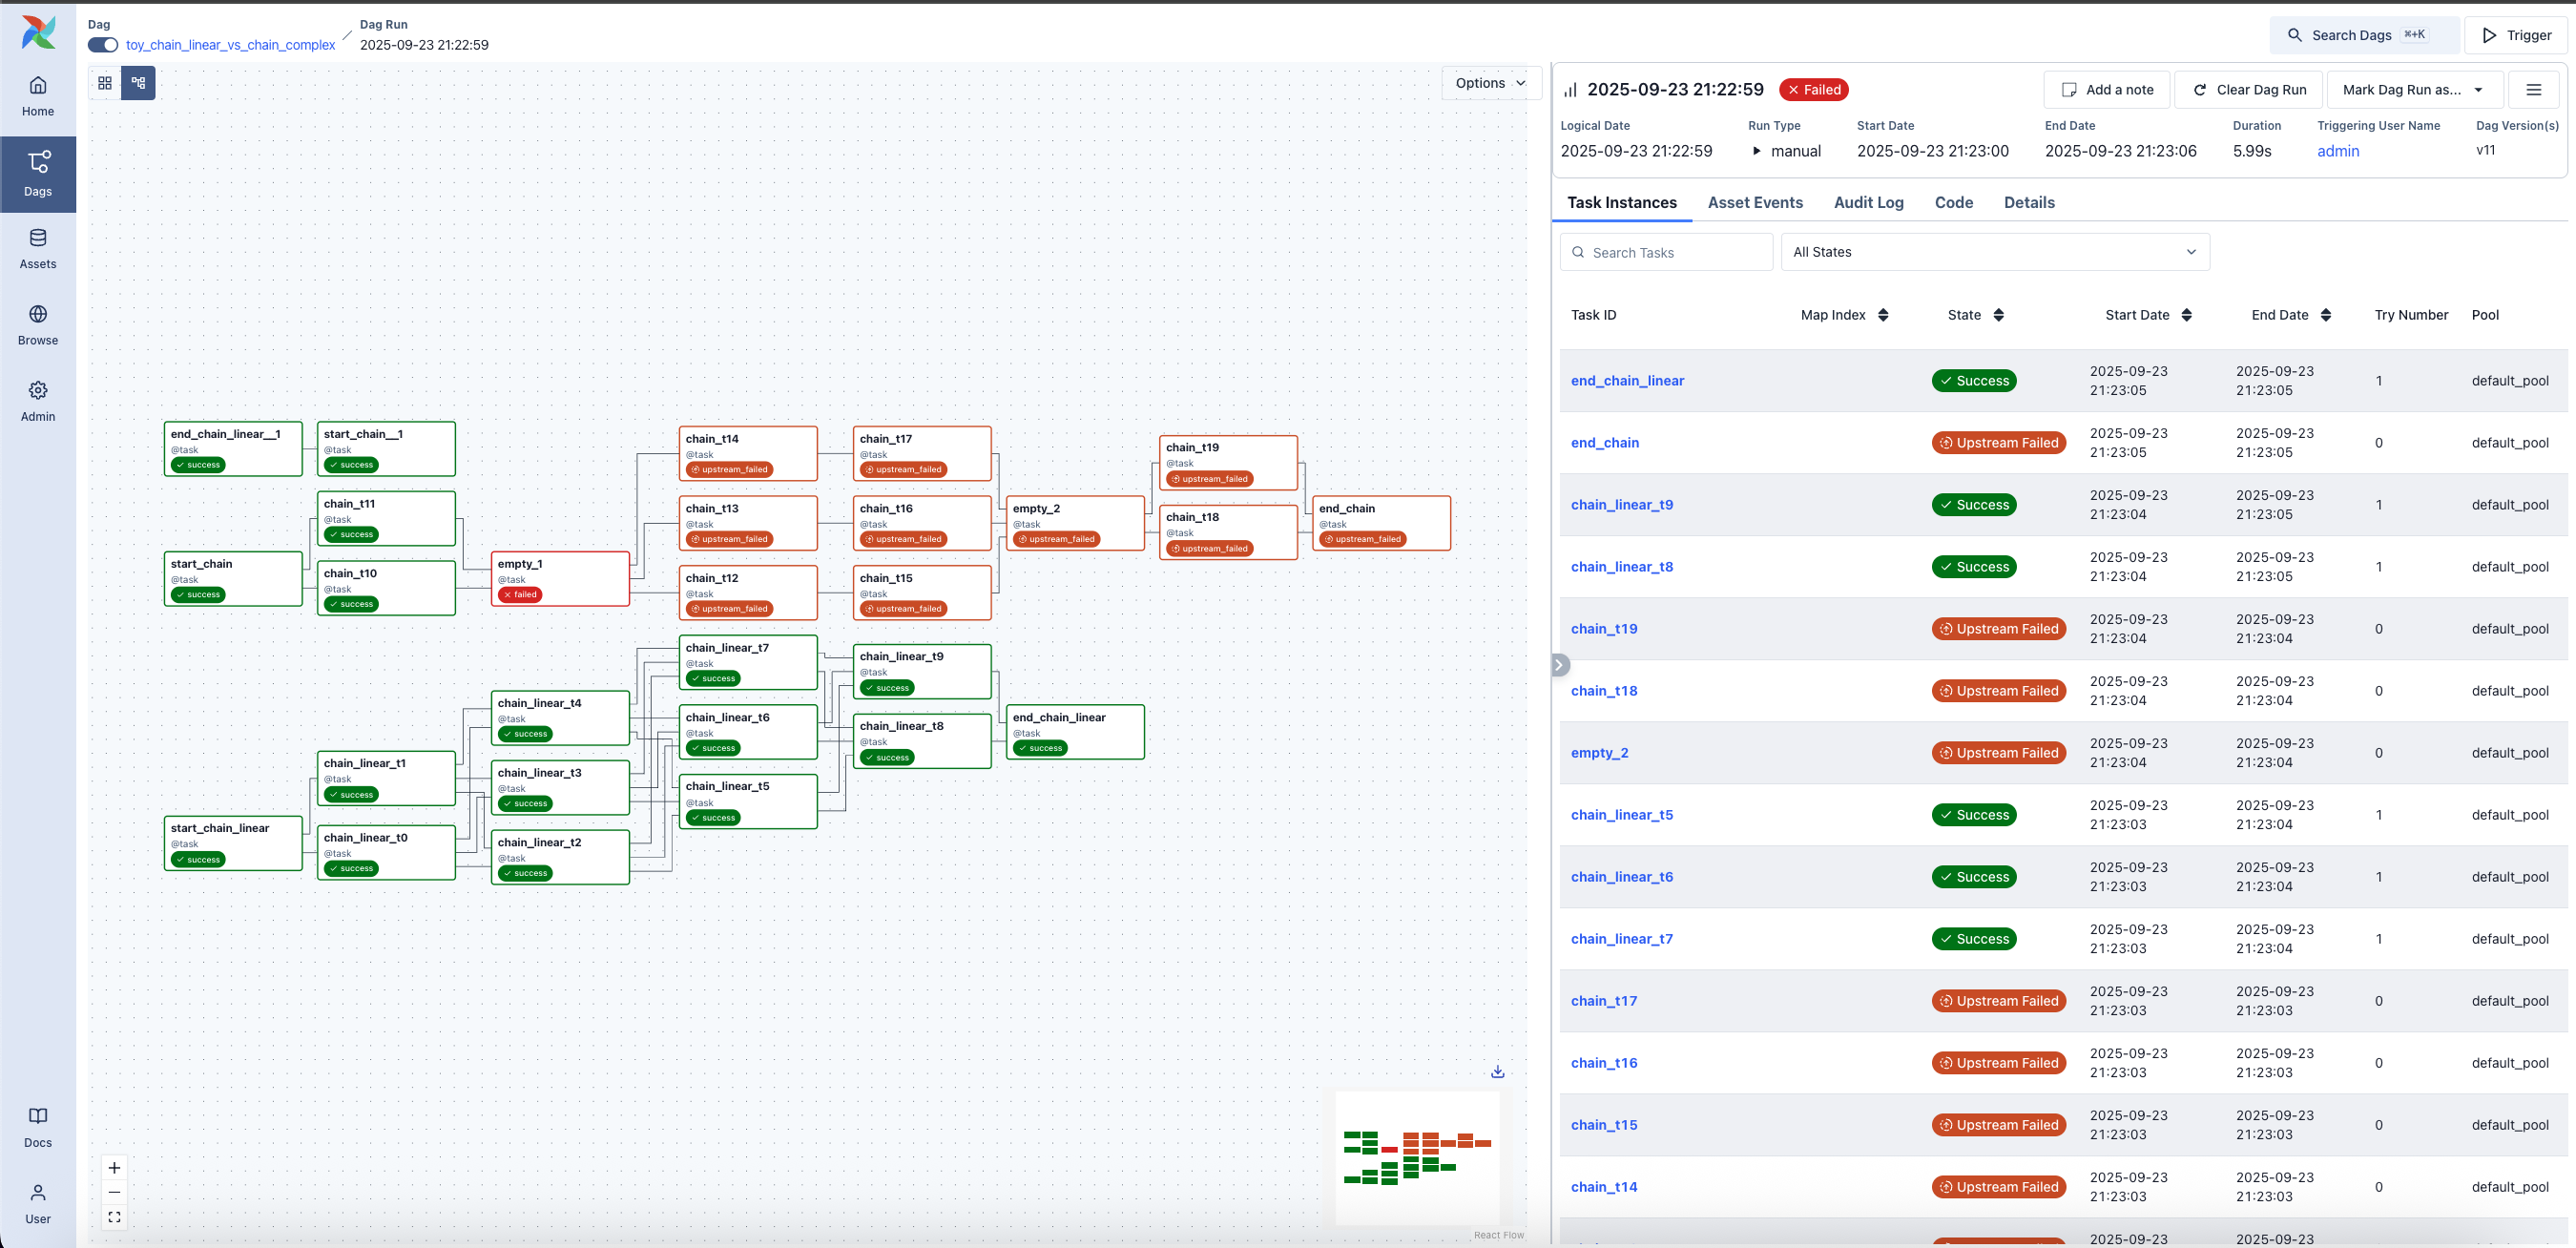
   ### Description

   In graph view, show the % of that tasks' execution time compared to total
execution time of the dagrun. I've also seen other cases where a small bar
graph is shown in the task rectangle but I think % is probably good enough.

   it would be really helpful to see at a glance from the graph view which
tasks are taking the longest.


https://airflow.apache.org/docs/apache-airflow/stable/_images/dag_run_graph1.png

   ### Use case/motivation

   for quickly triaging a long running dagrun

   ### Related issues

   _No response_

   ### Are you willing to submit a PR?

   - [ ] Yes I am willing to submit a PR!

   ### Code of Conduct

   - [x] I agree to follow this project's [Code of
Conduct](https://github.com/apache/airflow/blob/main/CODE_OF_CONDUCT.md)


--
This is an automated message from the Apache Git Service.
To respond to the message, please log on to GitHub and use the
URL above to go to the specific comment.

To unsubscribe, e-mail: [email protected]

For queries about this service, please contact Infrastructure at:
[email protected]