eddiesr93 opened a new pull request, #70305:
URL: https://github.com/apache/airflow/pull/70305
Adds a **Slowest tasks** chart to the Dag Overview tab: median duration per task across the runs in the selected time range, top 10, coloured by each task's latest state. Discussed in #62935, where adding more charts to the Overview tab was encouraged. Data comes from the existing task-instances endpoint (`success`/`failed` instances in the range), aggregated client side; no backend change. Dark and light, real runs (the red bar is a task whose latest instance failed): 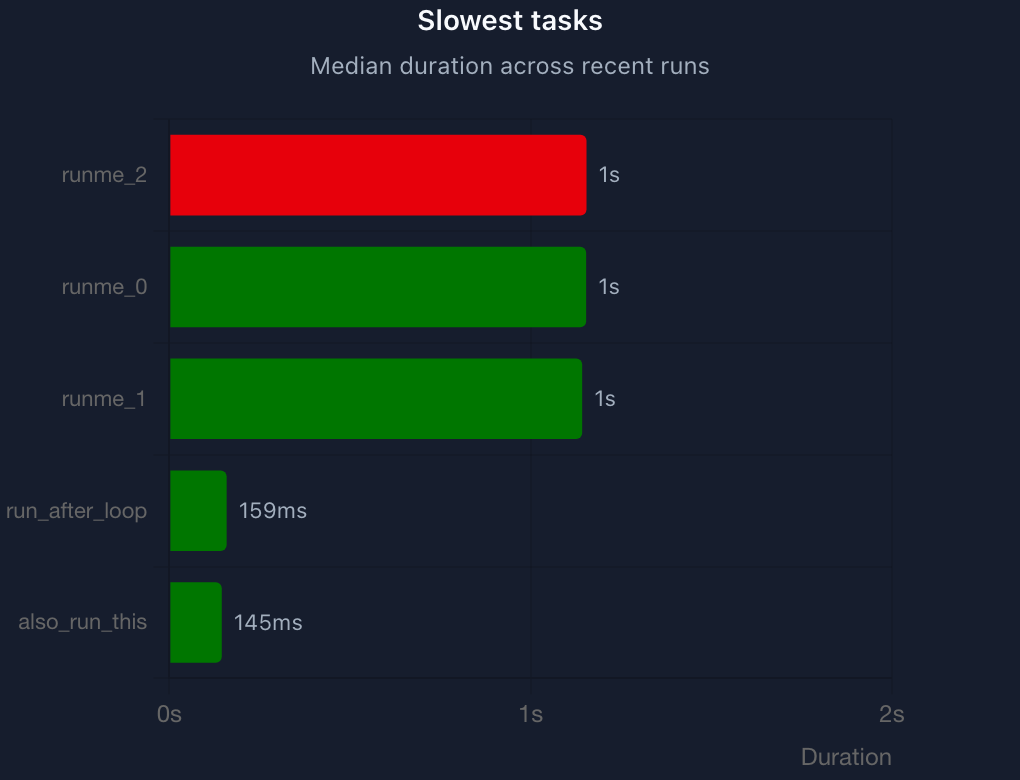 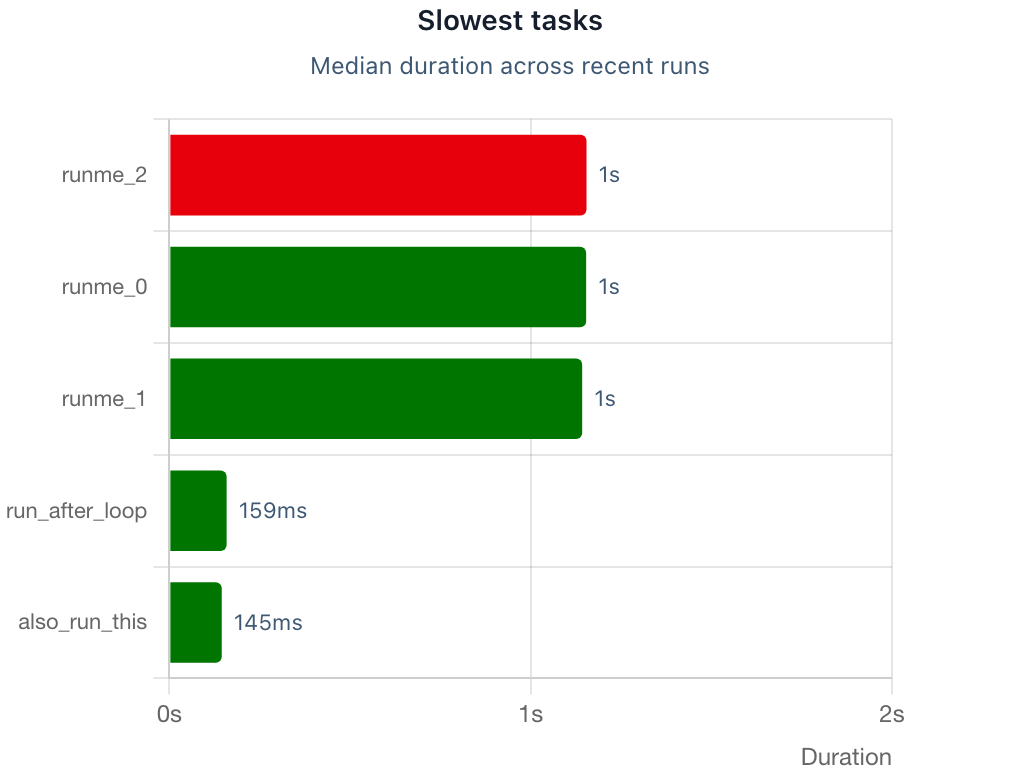 A 14-task Dag, capped at the top 10: 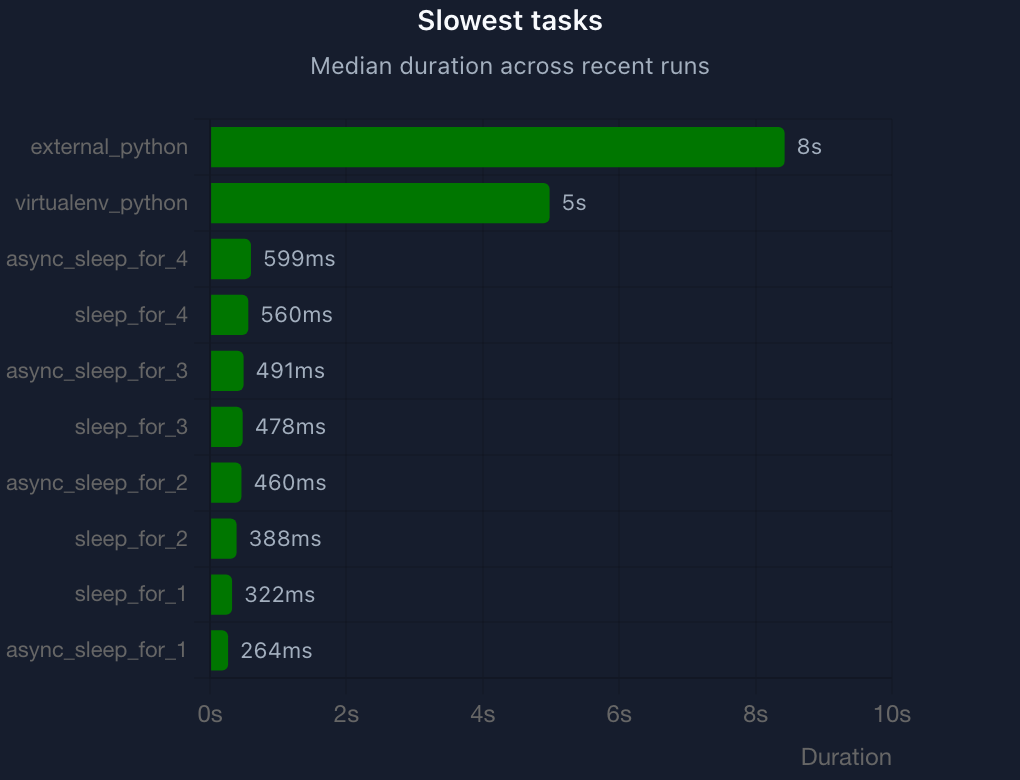 Tooltip shows the median and how many instances it is based on: 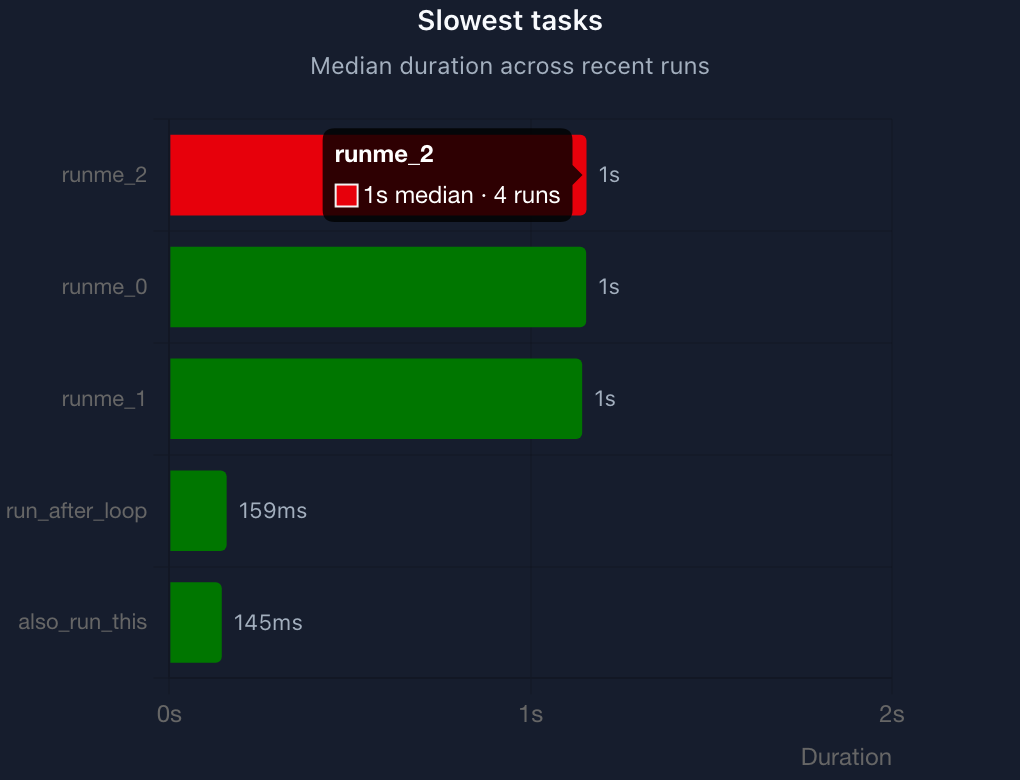 In context next to the existing run-duration chart: 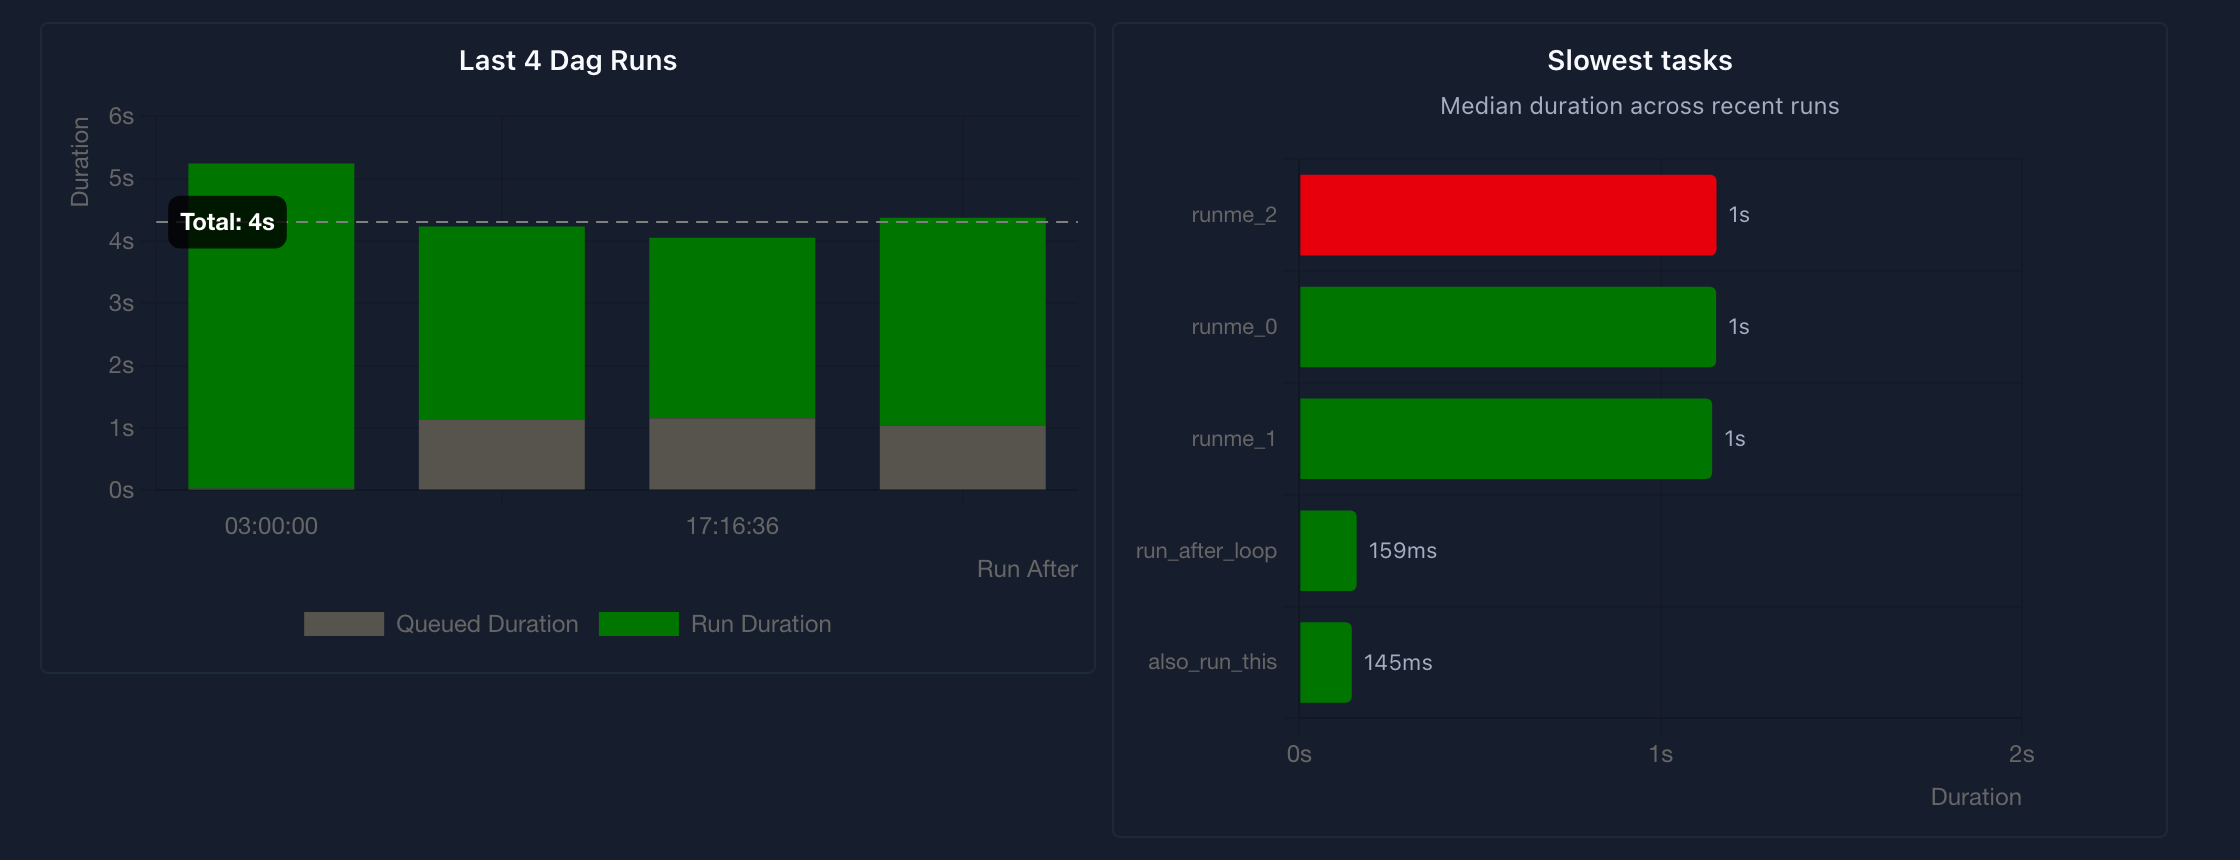 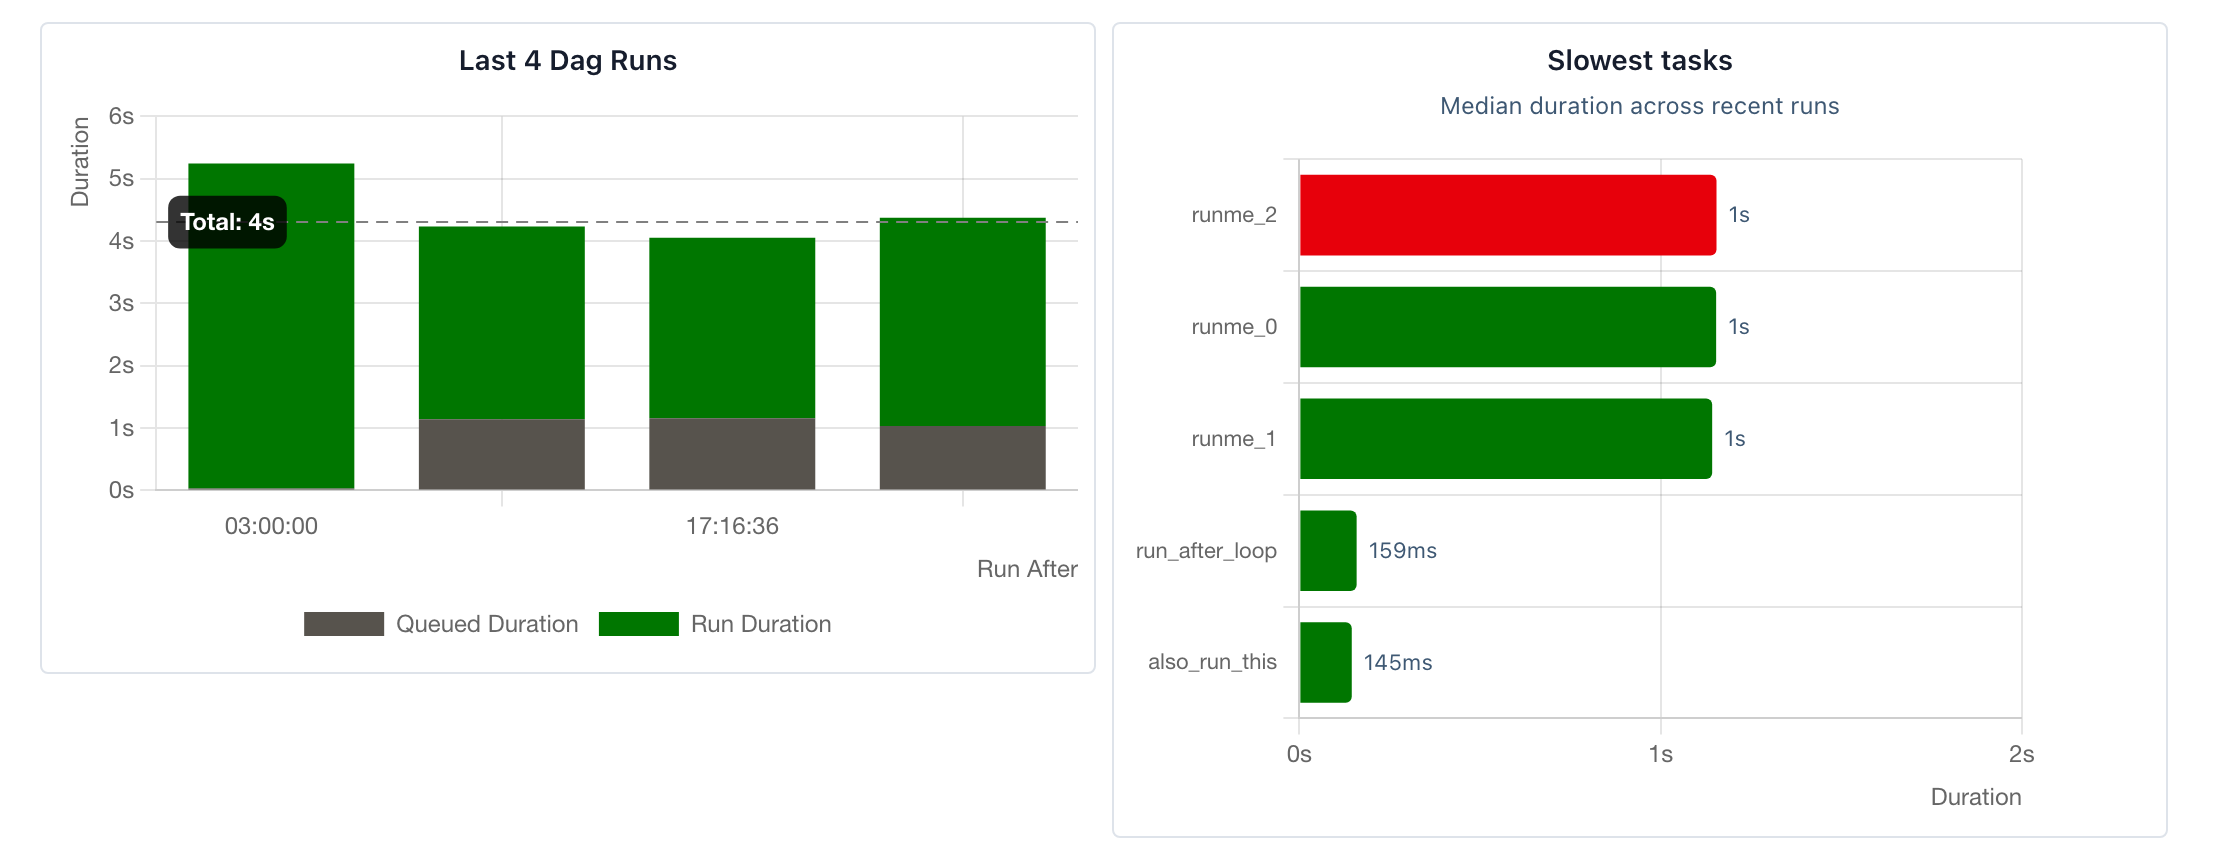 A Dag with no completed instances in the range: 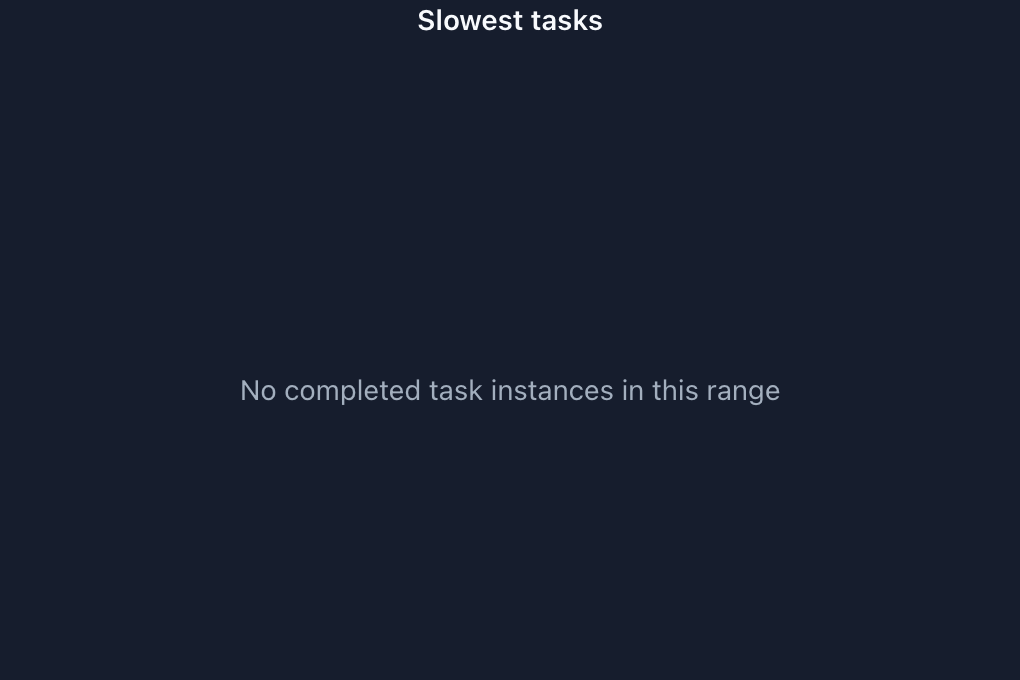 related: #62935 --- ##### Was generative AI tooling used to co-author this PR? - [X] Yes — Claude Code (Opus 4.8) Generated-by: Claude Code (Opus 4.8) following [the guidelines](https://github.com/apache/airflow/blob/main/contributing-docs/05_pull_requests.rst#gen-ai-assisted-contributions) --- Drafted-by: Claude Code (Opus 4.8); reviewed by @eddiesr93 before posting -- This is an automated message from the Apache Git Service. To respond to the message, please log on to GitHub and use the URL above to go to the specific comment. To unsubscribe, e-mail: [email protected] For queries about this service, please contact Infrastructure at: [email protected]







