JeffryMAC opened a new issue #8931:
URL: https://github.com/apache/airflow/issues/8931
**Description** airflow has many graph showing insights on task level (task duration, task tries, landing times, gantt) yet there are no graphs that show metrics on graph level I have a simple question that I want to see in a graph. Did the overall time the dag runs has increased or not? it can be simple graph just calculating the dag start time and stop time and putting all durations on one graph. something like: 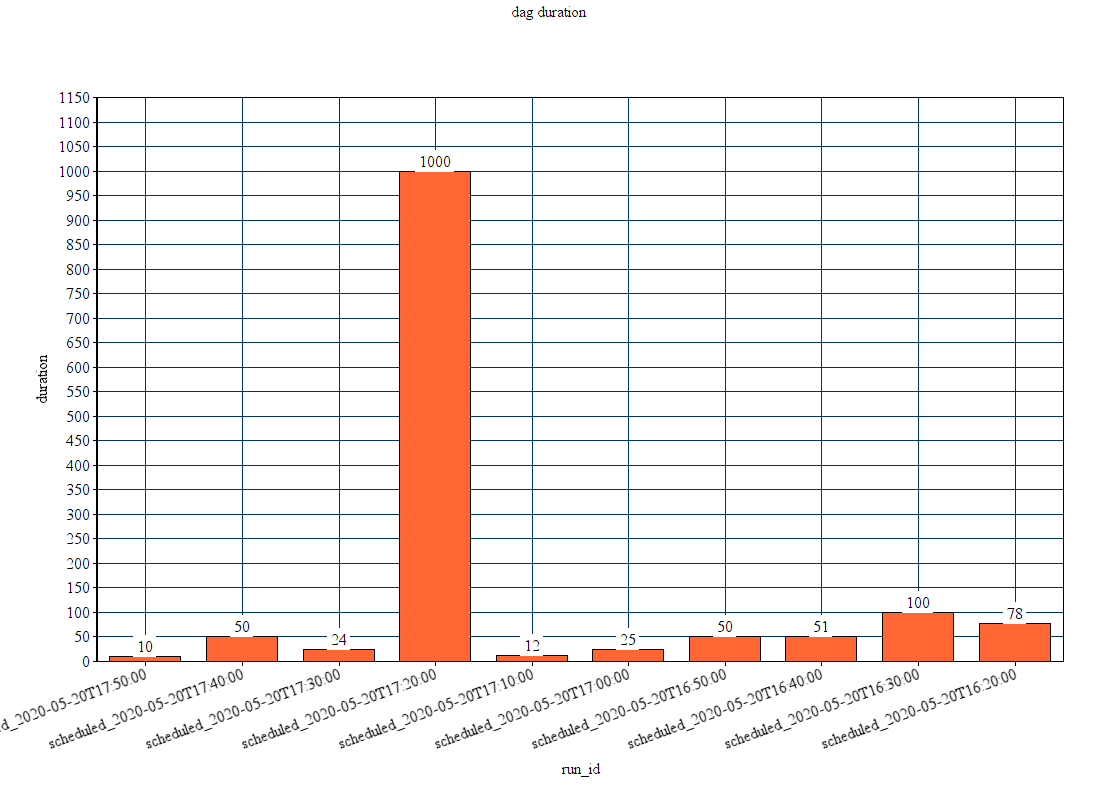 would be extra cool if it will allow to play with the duration units (seconds, minutes, hours, days) ---------------------------------------------------------------- This is an automated message from the Apache Git Service. To respond to the message, please log on to GitHub and use the URL above to go to the specific comment. For queries about this service, please contact Infrastructure at: [email protected]