Startrekzky commented on code in PR #3988:
URL:
https://github.com/apache/incubator-devlake/pull/3988#discussion_r1055221724
##########
grafana/dashboards/EngineeringOverview.json:
##########
@@ -1739,22 +1739,26 @@
"allValue": null,
"current": {
"selected": false,
- "text": "All",
- "value": "$__all"
+ "text": [
+ "p2"
+ ],
+ "value": [
+ "p2"
+ ]
},
"datasource": "mysql",
- "definition": "select concat(name, '-', id) as text from repos",
+ "definition": "select project_name from project_mapping",
Review Comment:
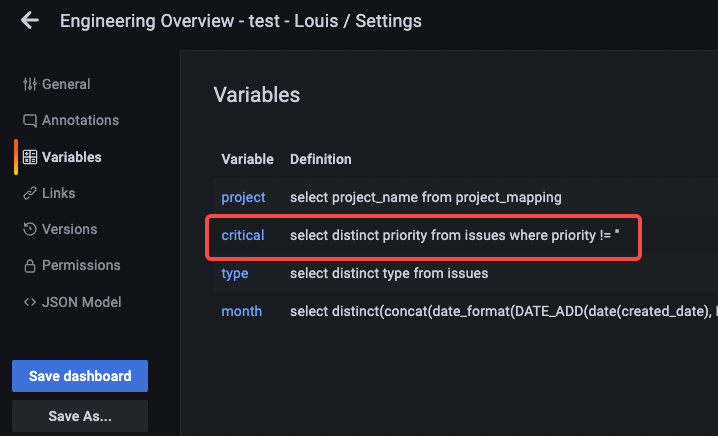
select distinct project_name from project_mapping?
##########
grafana/dashboards/EngineeringOverview.json:
##########
@@ -196,7 +196,7 @@
"metricColumn": "none",
"queryType": "randomWalk",
"rawQuery": true,
- "rawSql": "with _issues as(\n select\n
DATE_ADD(date(i.created_date), INTERVAL -DAY(date(i.created_date))+1 DAY) as
time,\n count(*) as defect_count\n from\n lake.issues i\n where\n
i.priority in ($critical)\n and i.type = 'BUG'\n and
$__timeFilter(i.created_date)\n and i.created_date >=
DATE_ADD(DATE_ADD($__timeFrom(), INTERVAL -DAY($__timeFrom())+1 DAY), INTERVAL
+1 MONTH)\n group by time\n)\n\nselect\n date_format(time,'%M %Y') as
month,\n defect_count\nfrom _issues\norder by time asc\n",
+ "rawSql": "with _issues as(\n select\n
DATE_ADD(date(i.created_date), INTERVAL -DAY(date(i.created_date))+1 DAY) as
time,\n count(*) as defect_count\n from\n lake.issues i\n join
board_issues bi on i.id = bi.issue_id\n\t join boards b on bi.board_id =
b.id\n\t join project_mapping pm on b.id = pm.row_id\n where\n
pm.project_name in ($project) and\n i.priority in ($critical)\n and
i.type = 'BUG'\n and $__timeFilter(i.created_date)\n and i.created_date
>= DATE_ADD(DATE_ADD($__timeFrom(), INTERVAL -DAY($__timeFrom())+1 DAY),
INTERVAL +1 MONTH)\n group by time\n)\n\nselect\n date_format(time,'%M %Y')
as month,\n defect_count\nfrom _issues\norder by time asc\n",
Review Comment:
Let's rename `$critical` to `$priority`, as it gets data from
issues.priority.
##########
grafana/dashboards/DORA.json:
##########
@@ -142,7 +143,7 @@
"metricColumn": "none",
"queryType": "randomWalk",
"rawQuery": true,
- "rawSql": "-- Metric 1: Deployment Frequency\nwith
last_few_calendar_months as(\n-- get the last few months within the selected
time period in the top-right corner\n\tSELECT CAST((SYSDATE()-INTERVAL (H+T+U)
DAY) AS date) day\n\tFROM ( SELECT 0 H\n\t\t\tUNION ALL SELECT 100 UNION ALL
SELECT 200 UNION ALL SELECT 300\n\t\t) H CROSS JOIN ( SELECT 0 T\n\t\t\tUNION
ALL SELECT 10 UNION ALL SELECT 20 UNION ALL SELECT 30\n\t\t\tUNION ALL
SELECT 40 UNION ALL SELECT 50 UNION ALL SELECT 60\n\t\t\tUNION ALL SELECT
70 UNION ALL SELECT 80 UNION ALL SELECT 90\n\t\t) T CROSS JOIN ( SELECT 0
U\n\t\t\tUNION ALL SELECT 1 UNION ALL SELECT 2 UNION ALL SELECT
3\n\t\t\tUNION ALL SELECT 4 UNION ALL SELECT 5 UNION ALL SELECT
6\n\t\t\tUNION ALL SELECT 7 UNION ALL SELECT 8 UNION ALL SELECT 9\n\t\t)
U\n\tWHERE\n\t\t(SYSDATE()-INTERVAL (H+T+U) DAY) >
$__timeFrom()\n),\n\n_days_weeks_deploy
as(\n\tSELECT\n\t\t\tdate(DATE_ADD(last_few_calendar_months.day, INTERVAL
-WEEKDAY(last
_few_calendar_months.day) DAY)) as week,\n\t\t\tMAX(if(deployments.day is not
null, 1, 0)) as week_deployed,\n\t\t\tCOUNT(distinct deployments.day) as
days_deployed\n\tFROM \n\t\tlast_few_calendar_months\n\t\tLEFT
JOIN(\n\t\t\tSELECT\n\t\t\t\tDATE(finished_date) AS
day,\n\t\t\t\tid\n\t\t\tFROM cicd_tasks\n\t\t\tWHERE\n\t\t\t\ttype =
'DEPLOYMENT'\n\t\t\t\tand result = 'SUCCESS') deployments ON deployments.day =
last_few_calendar_months.day\n\tGROUP BY week\n\t),\n\n_monthly_deploy
as(\n\tSELECT\n\t\t\tdate(DATE_ADD(last_few_calendar_months.day, INTERVAL
-DAY(last_few_calendar_months.day)+1 DAY)) as
month,\n\t\t\tMAX(if(deployments.day is not null, 1, 0)) as
months_deployed\n\tFROM \n\t\tlast_few_calendar_months\n\t\tLEFT
JOIN(\n\t\t\tSELECT\n\t\t\t\tDATE(finished_date) AS
day,\n\t\t\t\tid\n\t\t\tFROM cicd_tasks\n\t\t\tWHERE\n\t\t\t\ttype =
'DEPLOYMENT'\n\t\t\t\tand result = 'SUCCESS') deployments ON deployments.day =
last_few_calendar_months.day\n\tGROUP BY month\n\t),\n\n_median_num
ber_of_deployment_days_per_week as (\n\tSELECT x.days_deployed as
median_number_of_deployment_days_per_week from _days_weeks_deploy x,
_days_weeks_deploy y\n\tGROUP BY x.days_deployed\n\tHAVING
SUM(SIGN(1-SIGN(y.days_deployed-x.days_deployed)))/COUNT(*) > 0.5\n\tLIMIT
1\n),\n\n_median_number_of_deployment_days_per_month as (\n\tSELECT
x.months_deployed as median_number_of_deployment_days_per_month from
_monthly_deploy x, _monthly_deploy y\n\tGROUP BY x.months_deployed\n\tHAVING
SUM(SIGN(1-SIGN(y.months_deployed-x.months_deployed)))/COUNT(*) > 0.5\n\tLIMIT
1\n),\n\n_metric_deployment_frequency as (\n\tSELECT \n\t\t'Deployment
frequency' as metric,\n\t\tCASE \n\t\t\tWHEN
median_number_of_deployment_days_per_week >= 3 THEN 'On-demand'\n\t\t\tWHEN
median_number_of_deployment_days_per_week >= 1 THEN 'Between once per week and
once per month'\n\t\t\tWHEN median_number_of_deployment_days_per_month >= 1
THEN 'Between once per month and once every 6 months'\n\t\t\tELSE 'Fewer than
once per
six months' END AS value\n\tFROM _median_number_of_deployment_days_per_week,
_median_number_of_deployment_days_per_month\n),\n\n-- Metric 2: median change
lead time\n_pr_stats as (\n-- get PRs' cycle time in the selected
period\n\tSELECT\n\t\tpr.id,\n\t\tpr.change_timespan as
pr_cycle_time\n\tFROM\n\t\tpull_requests pr\n\tWHERE\n\t\tpr.merged_date is not
null\n\t\tand pr.change_timespan is not null\n\t\tand
$__timeFilter(pr.merged_date)\n),\n\n_median_change_lead_time as (\n-- use
median PR cycle time as the median change lead time\n\tSELECT x.pr_cycle_time
as median_change_lead_time from _pr_stats x, _pr_stats y\n\tGROUP BY
x.pr_cycle_time\n\tHAVING
SUM(SIGN(1-SIGN(y.pr_cycle_time-x.pr_cycle_time)))/COUNT(*) > 0.5\n\tLIMIT
1\n),\n\n_metric_change_lead_time as (\n\tSELECT \n\t\t'Lead time for changes'
as metric,\n\t\tCASE\n\t\t\tWHEN median_change_lead_time < 60 then \"Less than
one hour\"\n\t\t\tWHEN median_change_lead_time < 7 * 24 * 60 then \"Less than
one week\"\n\t\t\tWHEN medi
an_change_lead_time < 180 * 24 * 60 then \"Between one week and six
months\"\n\t\t\tELSE \"More than six months\"\n\t\t\tEND as value\nFROM
_median_change_lead_time\n),\n\n\n-- Metric 3: Median time to restore service
\n_incidents as (\n-- get the incidents created within the selected time period
in the top-right corner\n\tSELECT\n\t\tcast(lead_time_minutes as signed) as
lead_time_minutes\n\tFROM\n\t\tissues\n\tWHERE\n\t\ttype = 'INCIDENT'\n\t\tand
$__timeFilter(created_date)\n),\n\n_median_mttr as (\n\tSELECT
\n\t\tx.lead_time_minutes as med_time_to_resolve\n\tfrom _incidents x,
_incidents y\n\tWHERE x.lead_time_minutes is not null and y.lead_time_minutes
is not null\n\tGROUP BY x.lead_time_minutes\n\tHAVING
SUM(SIGN(1-SIGN(y.lead_time_minutes-x.lead_time_minutes)))/COUNT(*) >
0.5\n\tLIMIT 1\n),\n\n\n_metric_mttr as (\n\tSELECT \n\t\t'Time to restore
service' as metric,\n\t\tcase\n\t\t\tWHEN med_time_to_resolve < 60 then \"Less
than one hour\"\n\t\t\tWHEN med_time_to_resolve < 24
* 60 then \"Less than one Day\"\n\t\t\tWHEN med_time_to_resolve < 7 * 24 * 60
then \"Between one day and one week\"\n\t\t\tELSE \"More than one
week\"\n\t\t\tEND as value\n\tFROM \n\t\t_median_mttr\n),\n\n-- Metric 4:
change failure rate\n_deployment_count as (\n-- get the deployment deployed
within the selected time period in the top-right
corner\n\tSELECT\n\t\tCOUNT(distinct id) AS
deployment_count\n\tFROM\n\t\tcicd_tasks\n\tWHERE\n\t\ttype =
'DEPLOYMENT'\n\t\tand result = 'SUCCESS'\n and
$__timeFilter(finished_date)\n),\n\n_incident_count as (\n-- get the incident
created within the selected time period in the top-right
corner\n\tSELECT\n\t\tCOUNT(distinct id) AS
incident_count\n\tFROM\n\t\tissues\n\tWHERE\n\t\ttype = 'INCIDENT'\n\t\tand
$__timeFilter(created_date)\n),\n\n_metric_cfr as (\n\tSELECT \n\t\t'Change
failure rate' as metric,\n\t\tcase \n\t\t\twhen deployment_count is null or
incident_count is null or deployment_count = 0 then NULL \n\t\t\twhen
incident_count/deplo
yment_count <= .15 then \"0-15%\"\n\t\t\twhen incident_count/deployment_count
<= .20 then \"16%-20%\"\n\t\t\twhen incident_count/deployment_count <= .30 then
\"21%-30%\"\n\t\t\telse \"> 30%\"\n\t\t\tend as value\n\tFROM
\n\t\t_deployment_count, _incident_count\n),\n\n_final_results as (\t\n\tSELECT
distinct db.id,db.metric,db.low,db.medium,db.high,db.elite,m1.metric as
_metric, m1.value FROM dora_benchmarks db\n\tleft join
_metric_deployment_frequency m1 on db.metric = m1.metric\n\tWHERE m1.metric is
not null\n\t\n\tunion \n\t\n\tSELECT distinct
db.id,db.metric,db.low,db.medium,db.high,db.elite,m2.metric as _metric,
m2.value FROM dora_benchmarks db\n\tleft join _metric_change_lead_time m2 on
db.metric = m2.metric\n\tWHERE m2.metric is not null\n\t\n\tunion
\n\t\n\tSELECT distinct
db.id,db.metric,db.low,db.medium,db.high,db.elite,m3.metric as _metric,
m3.value FROM dora_benchmarks db\n\tleft join _metric_mttr m3 on db.metric =
m3.metric\n\tWHERE m3.metric is not null\n\t\n\tunion \n\
t\n\tSELECT distinct
db.id,db.metric,db.low,db.medium,db.high,db.elite,m4.metric as _metric,
m4.value FROM dora_benchmarks db\n\tleft join _metric_cfr m4 on db.metric =
m4.metric\n\tWHERE m4.metric is not null\n)\n\n\nSELECT \n\tmetric,\n\tcase
when low = value then low else null end as low,\n\tcase when medium = value
then medium else null end as medium,\n\tcase when high = value then high else
null end as high,\n\tcase when elite = value then elite else null end as
elite\nFROM _final_results\nORDER BY id",
+ "rawSql": "-- Metric 1: Deployment Frequency\nwith
last_few_calendar_months as(\n-- get the last few months within the selected
time period in the top-right corner\n\tSELECT CAST((SYSDATE()-INTERVAL (H+T+U)
DAY) AS date) day\n\tFROM ( SELECT 0 H\n\t\t\tUNION ALL SELECT 100 UNION ALL
SELECT 200 UNION ALL SELECT 300\n\t\t) H CROSS JOIN ( SELECT 0 T\n\t\t\tUNION
ALL SELECT 10 UNION ALL SELECT 20 UNION ALL SELECT 30\n\t\t\tUNION ALL
SELECT 40 UNION ALL SELECT 50 UNION ALL SELECT 60\n\t\t\tUNION ALL SELECT
70 UNION ALL SELECT 80 UNION ALL SELECT 90\n\t\t) T CROSS JOIN ( SELECT 0
U\n\t\t\tUNION ALL SELECT 1 UNION ALL SELECT 2 UNION ALL SELECT
3\n\t\t\tUNION ALL SELECT 4 UNION ALL SELECT 5 UNION ALL SELECT
6\n\t\t\tUNION ALL SELECT 7 UNION ALL SELECT 8 UNION ALL SELECT 9\n\t\t)
U\n\tWHERE\n\t\t(SYSDATE()-INTERVAL (H+T+U) DAY) >
$__timeFrom()\n),\n\n_days_weeks_deploy
as(\n\tSELECT\n\t\t\tdate(DATE_ADD(last_few_calendar_months.day, INTERVAL
-WEEKDAY(last
_few_calendar_months.day) DAY)) as week,\n\t\t\tMAX(if(deployments.day is not
null, 1, 0)) as week_deployed,\n\t\t\tCOUNT(distinct deployments.day) as
days_deployed\n\tFROM \n\t\tlast_few_calendar_months\n\t\tLEFT
JOIN(\n\t\t\tSELECT\n\t\t\t\tDATE(finished_date) AS
day,\n\t\t\t\tid\n\t\t\tFROM cicd_tasks ct\n\t\t\tjoin project_mapping pm on
ct.cicd_scope_id = pm.row_id\n\t\t\tWHERE\n\t\t\t pm.project_name in
($project)\n\t\t\t\tand type = 'DEPLOYMENT'\n\t\t\t\tand result = 'SUCCESS')
deployments ON deployments.day = last_few_calendar_months.day\n\tGROUP BY
week\n\t),\n\n_monthly_deploy
as(\n\tSELECT\n\t\t\tdate(DATE_ADD(last_few_calendar_months.day, INTERVAL
-DAY(last_few_calendar_months.day)+1 DAY)) as
month,\n\t\t\tMAX(if(deployments.day is not null, 1, 0)) as
months_deployed\n\tFROM \n\t\tlast_few_calendar_months\n\t\tLEFT
JOIN(\n\t\t\tSELECT\n\t\t\t\tDATE(finished_date) AS
day,\n\t\t\t\tid\n\t\t\tFROM cicd_tasks ct\n\t\t\tjoin project_mapping pm on
ct.cicd_scope_id = pm.row_id\
n\t\t\tWHERE\n\t\t\t pm.project_name in ($project)\n\t\t\t\tand type =
'DEPLOYMENT'\n\t\t\t\tand result = 'SUCCESS') deployments ON deployments.day =
last_few_calendar_months.day\n\tGROUP BY
month\n\t),\n\n_median_number_of_deployment_days_per_week as (\n\tSELECT
x.days_deployed as median_number_of_deployment_days_per_week from
_days_weeks_deploy x, _days_weeks_deploy y\n\tGROUP BY
x.days_deployed\n\tHAVING
SUM(SIGN(1-SIGN(y.days_deployed-x.days_deployed)))/COUNT(*) > 0.5\n\tLIMIT
1\n),\n\n_median_number_of_deployment_days_per_month as (\n\tSELECT
x.months_deployed as median_number_of_deployment_days_per_month from
_monthly_deploy x, _monthly_deploy y\n\tGROUP BY x.months_deployed\n\tHAVING
SUM(SIGN(1-SIGN(y.months_deployed-x.months_deployed)))/COUNT(*) > 0.5\n\tLIMIT
1\n),\n\n_metric_deployment_frequency as (\n\tSELECT \n\t\t'Deployment
frequency' as metric,\n\t\tCASE \n\t\t\tWHEN
median_number_of_deployment_days_per_week >= 3 THEN 'On-demand'\n\t\t\tWHEN
median_number_of_deploym
ent_days_per_week >= 1 THEN 'Between once per week and once per
month'\n\t\t\tWHEN median_number_of_deployment_days_per_month >= 1 THEN
'Between once per month and once every 6 months'\n\t\t\tELSE 'Fewer than once
per six months' END AS value\n\tFROM
_median_number_of_deployment_days_per_week,
_median_number_of_deployment_days_per_month\n),\n\n-- Metric 2: median change
lead time\n_pr_stats as (\n-- get PRs' cycle time in the selected
period\n\tSELECT\n\t\tpr.id,\n\t\tprm.pr_cycle_time\n\tFROM\n\t\tpull_requests
pr\n\t\tjoin project_pr_metrics prm on prm.id = pr.id\n\t\tjoin project_mapping
pm on pr.base_repo_id = pm.row_id\n\tWHERE\n\t pm.project_name in ($project)
\n\t\tand pr.merged_date is not null\n\t\tand prm.pr_cycle_time is not
null\n\t\tand $__timeFilter(pr.merged_date)\n),\n\n_median_change_lead_time as
(\n-- use median PR cycle time as the median change lead time\n\tSELECT
x.pr_cycle_time as median_change_lead_time from _pr_stats x, _pr_stats
y\n\tGROUP BY x.pr_cycle_tim
e\n\tHAVING SUM(SIGN(1-SIGN(y.pr_cycle_time-x.pr_cycle_time)))/COUNT(*) >
0.5\n\tLIMIT 1\n),\n\n_metric_change_lead_time as (\n\tSELECT \n\t\t'Lead time
for changes' as metric,\n\t\tCASE\n\t\t\tWHEN median_change_lead_time < 60 then
\"Less than one hour\"\n\t\t\tWHEN median_change_lead_time < 7 * 24 * 60 then
\"Less than one week\"\n\t\t\tWHEN median_change_lead_time < 180 * 24 * 60 then
\"Between one week and six months\"\n\t\t\tELSE \"More than six
months\"\n\t\t\tEND as value\nFROM _median_change_lead_time\n),\n\n\n-- Metric
3: Median time to restore service \n_incidents as (\n-- get the incidents
created within the selected time period in the top-right
corner\n\tSELECT\n\t\tcast(lead_time_minutes as signed) as
lead_time_minutes\n\tFROM\n\t\tissues i\n\t join board_issues bi on i.id =
bi.issue_id\n\t join boards b on bi.board_id = b.id\n\t join project_mapping
pm on b.id = pm.row_id\n\tWHERE\n\t pm.project_name in ($project)\n\t\tand
i.type = 'INCIDENT'\n\t\tand $__timeFilter
(i.created_date)\n),\n\n_median_mttr as (\n\tSELECT \n\t\tx.lead_time_minutes
as med_time_to_resolve\n\tfrom _incidents x, _incidents y\n\tWHERE
x.lead_time_minutes is not null and y.lead_time_minutes is not null\n\tGROUP BY
x.lead_time_minutes\n\tHAVING
SUM(SIGN(1-SIGN(y.lead_time_minutes-x.lead_time_minutes)))/COUNT(*) >
0.5\n\tLIMIT 1\n),\n\n\n_metric_mttr as (\n\tSELECT \n\t\t'Time to restore
service' as metric,\n\t\tcase\n\t\t\tWHEN med_time_to_resolve < 60 then \"Less
than one hour\"\n\t\t\tWHEN med_time_to_resolve < 24 * 60 then \"Less than one
Day\"\n\t\t\tWHEN med_time_to_resolve < 7 * 24 * 60 then \"Between one day and
one week\"\n\t\t\tELSE \"More than one week\"\n\t\t\tEND as value\n\tFROM
\n\t\t_median_mttr\n),\n\n-- Metric 4: change failure rate\n_deployment_count
as (\n-- get the deployment deployed within the selected time period in the
top-right corner\n\tSELECT\n\t\tCOUNT(distinct id) AS
deployment_count\n\tFROM\n\t\tcicd_tasks ct\n\t\tjoin project_mapping pm on
ct.cicd_scope_id = pm.row_id\n\tWHERE\n\t pm.project_name in
($project)\n\t\tand type = 'DEPLOYMENT'\n\t\tand result = 'SUCCESS'\n and
$__timeFilter(finished_date)\n),\n\n_incident_count as (\n-- get the incident
created within the selected time period in the top-right
corner\n\tSELECT\n\t\tCOUNT(distinct i.id) AS
incident_count\n\tFROM\n\t\tissues i\n\t join board_issues bi on i.id =
bi.issue_id\n\t join boards b on bi.board_id = b.id\n\t join project_mapping
pm on b.id = pm.row_id\n\tWHERE\n\t pm.project_name in ($project) \n\t and
i.type = 'INCIDENT'\n\t\tand $__timeFilter(i.created_date)\n),\n\n_metric_cfr
as (\n\tSELECT \n\t\t'Change failure rate' as metric,\n\t\tcase \n\t\t\twhen
deployment_count is null or incident_count is null or deployment_count = 0 then
NULL \n\t\t\twhen incident_count/deployment_count <= .15 then
\"0-15%\"\n\t\t\twhen incident_count/deployment_count <= .20 then
\"16%-20%\"\n\t\t\twhen incident_count/deployment_count <= .30 then
\"21%-30%\"\n\t\t
\telse \"> 30%\"\n\t\t\tend as value\n\tFROM \n\t\t_deployment_count,
_incident_count\n),\n\n_final_results as (\t\n\tSELECT distinct
db.id,db.metric,db.low,db.medium,db.high,db.elite,m1.metric as _metric,
m1.value FROM dora_benchmarks db\n\tleft join _metric_deployment_frequency m1
on db.metric = m1.metric\n\tWHERE m1.metric is not null\n\t\n\tunion
\n\t\n\tSELECT distinct
db.id,db.metric,db.low,db.medium,db.high,db.elite,m2.metric as _metric,
m2.value FROM dora_benchmarks db\n\tleft join _metric_change_lead_time m2 on
db.metric = m2.metric\n\tWHERE m2.metric is not null\n\t\n\tunion
\n\t\n\tSELECT distinct
db.id,db.metric,db.low,db.medium,db.high,db.elite,m3.metric as _metric,
m3.value FROM dora_benchmarks db\n\tleft join _metric_mttr m3 on db.metric =
m3.metric\n\tWHERE m3.metric is not null\n\t\n\tunion \n\t\n\tSELECT distinct
db.id,db.metric,db.low,db.medium,db.high,db.elite,m4.metric as _metric,
m4.value FROM dora_benchmarks db\n\tleft join _metric_cfr m4 on db.metric =
m4.met
ric\n\tWHERE m4.metric is not null\n)\n\n\nSELECT \n\tmetric,\n\tcase when low
= value then low else null end as low,\n\tcase when medium = value then medium
else null end as medium,\n\tcase when high = value then high else null end as
high,\n\tcase when elite = value then elite else null end as elite\nFROM
_final_results\nORDER BY id",
Review Comment:
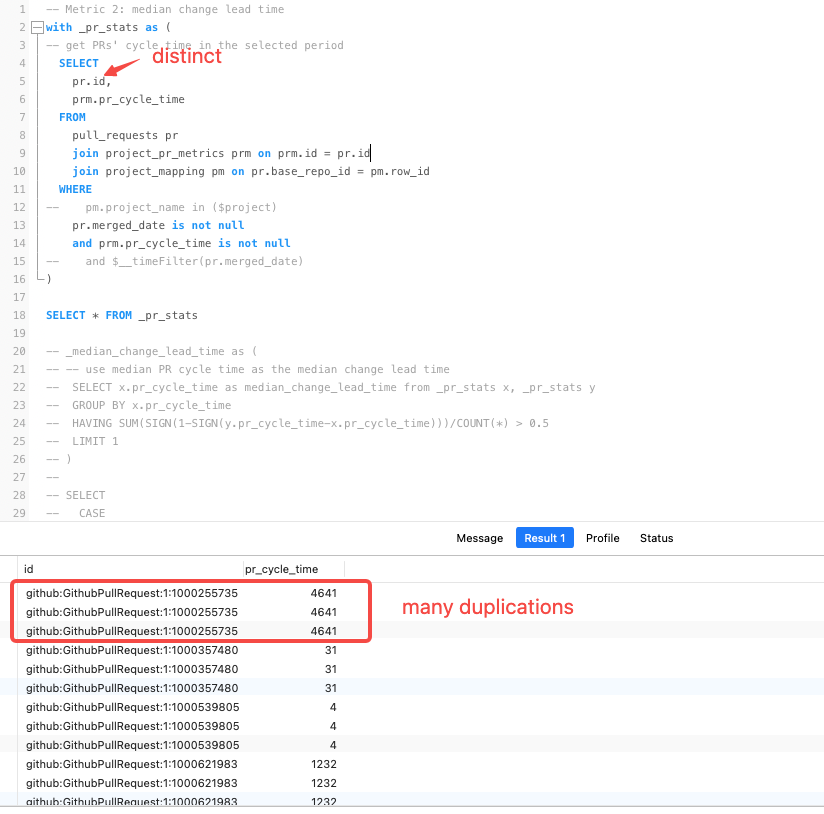
-- Metric 2: median change lead time
Should add a distinct in _pr_stats, otherwise, the SQL will be timeout. The
same goes to the SQL in panel `Overall DORA Metrics`
##########
grafana/dashboards/EngineeringThroughputAndCycleTime.json:
##########
@@ -167,7 +167,7 @@
"hide": false,
"metricColumn": "none",
"rawQuery": true,
- "rawSql": "SELECT\n DATE_ADD(date(created_date), INTERVAL
-$interval(date(created_date))+1 DAY) as time,\n count(id) as \"PR:
Opened\",\n count(distinct case when merged_date is not null then id else null
end) as \"PR: Merged\"\nFROM pull_requests\nWHERE\n
$__timeFilter(created_date)\n and base_repo_id in ($repo_id)\ngroup by 1\n",
+ "rawSql": "SELECT\n DATE_ADD(date(created_date), INTERVAL
-$interval(date(created_date))+1 DAY) as time,\n count(id) as \"PR:
Opened\",\n count(distinct case when merged_date is not null then id else null
end) as \"PR: Merged\"\nFROM pull_requests pr\n join project_mapping pm on
pr.base_repo_id = pm.row_id\nWHERE\n $__timeFilter(created_date)\n and
pm.project_name in ($project)\ngroup by 1\n",
Review Comment:
Despite there's only one `created_date`, I suggest you adding the table name
before it to avoid confusion, i.e. `pr.created_date`
--
This is an automated message from the Apache Git Service.
To respond to the message, please log on to GitHub and use the
URL above to go to the specific comment.
To unsubscribe, e-mail: [email protected]
For queries about this service, please contact Infrastructure at:
[email protected]