NikitaElmanov opened a new issue, #13293:
URL: https://github.com/apache/druid/issues/13293
Hi! I'm using druid 0.23.0 version in 2 stands (develop stand and load testing stand). Of course, DEV stand has fewer resources than LT, because of it in DEV applies **nano-quickstart** configuration and in LT deployed **small** configuration. The transfer data chain looks like: Kafka -> Druid -> Grafana. And I ran into display problem. Data does not come every second in Kafka (approximate range between metrics equals 10 seconds). 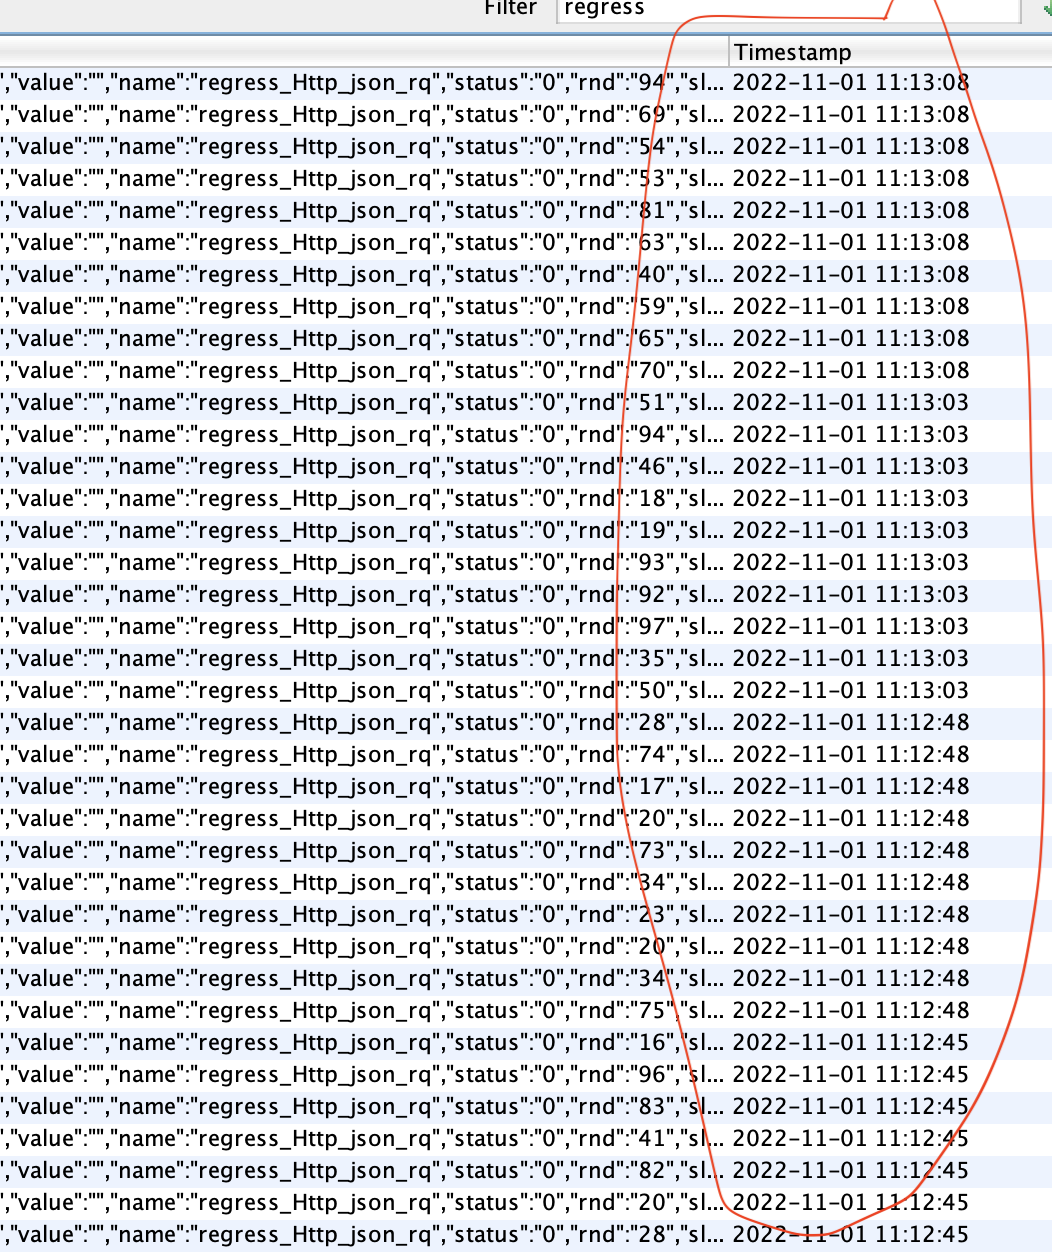 In Druid (LT stand) data is sending every seconds into Grafana despite the fact that metrics in Kafka have a range. As i guess, Druid fill data spaces out by itself. Therefore i have next result in data inspector Grafana: 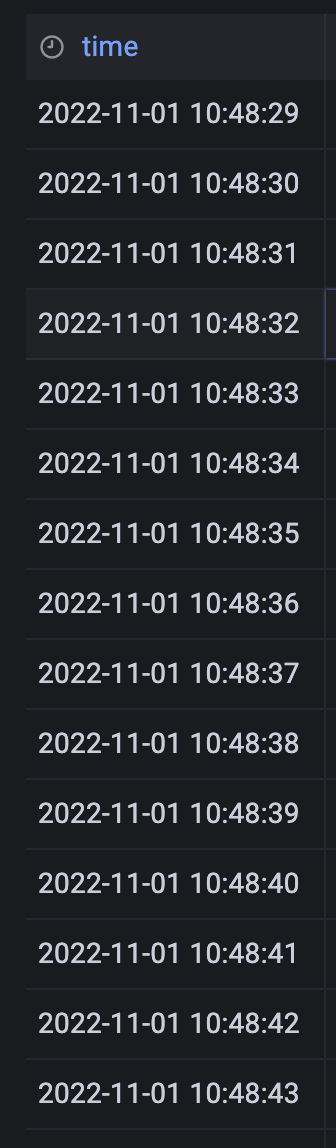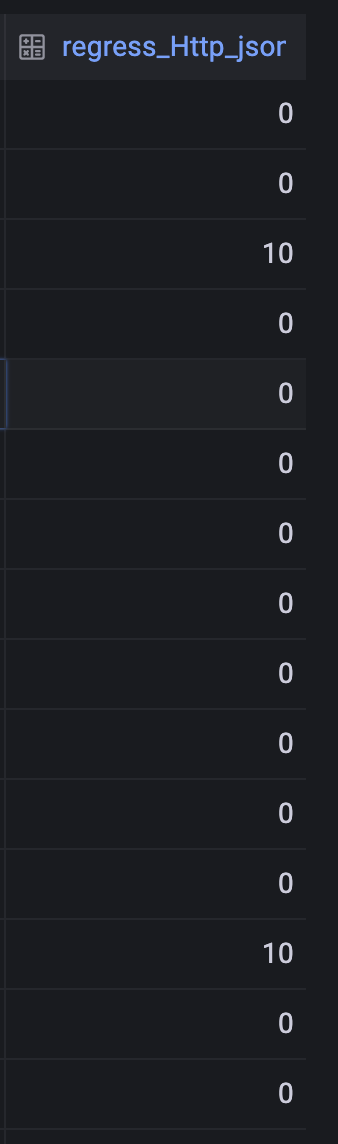 In develop stand data inspector in Grafana shows: 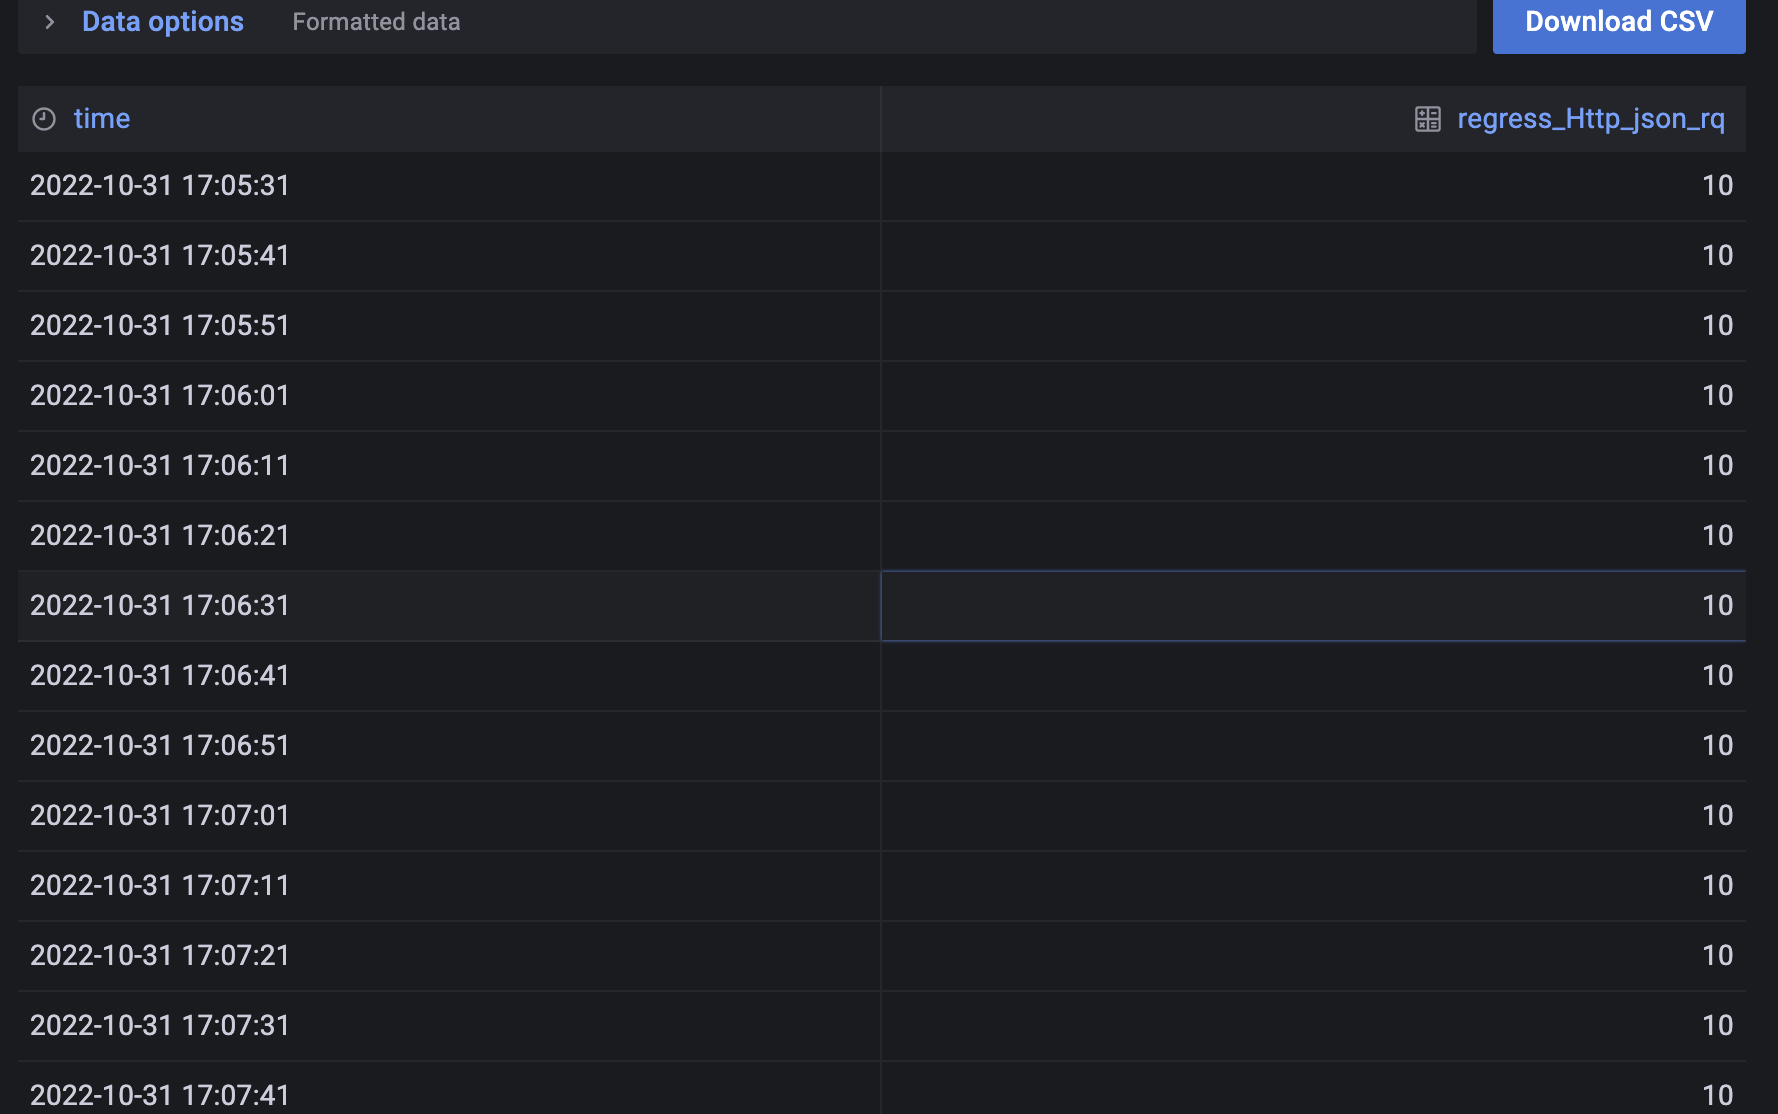 As you can see, in develop stand Druid does not send 0 number, but i want in DEV stand data is showed like in LT with 0 signs. I tested and compared all config files for **small** and **nano-quickstart** but except differences with resources, threads and connections did not find( -- This is an automated message from the Apache Git Service. To respond to the message, please log on to GitHub and use the URL above to go to the specific comment. To unsubscribe, e-mail: [email protected] For queries about this service, please contact Infrastructure at: [email protected] --------------------------------------------------------------------- To unsubscribe, e-mail: [email protected] For additional commands, e-mail: [email protected]