justynabukiel commented on issue #12023: Lags when using timeline with many (> 100) items with SVG rendering URL: https://github.com/apache/incubator-echarts/issues/12023#issuecomment-573671555 First of all, thanks for answering my ticket. I have data (to be specific: user's statistics) from several years grouped by different time ranges: by years, months and weeks. Each time I change grouping parameter, I redraw the chart. For years and months it works well, because there are not so many items on the timeline. Here's an exmaple of grouping by years. 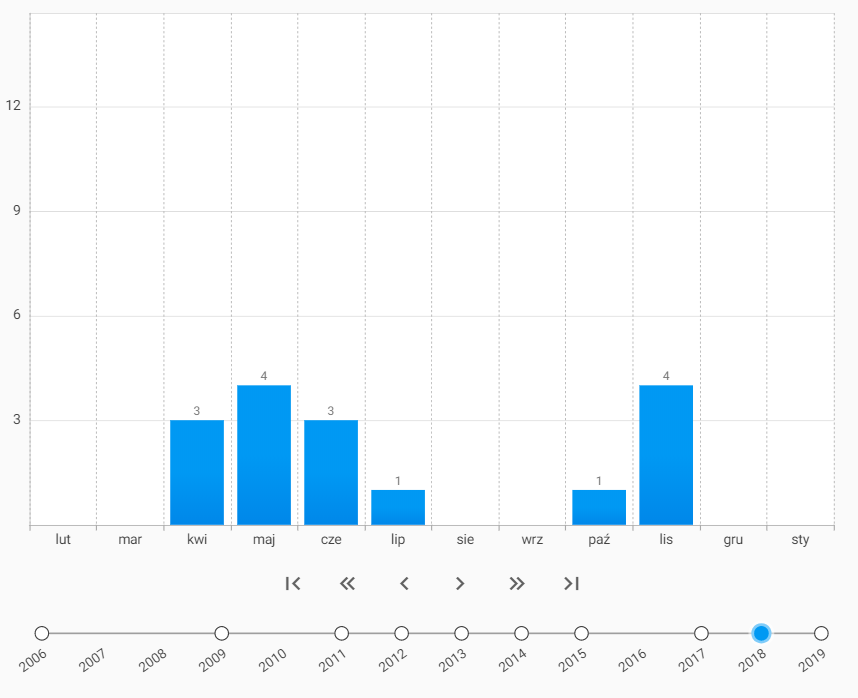 But when I switch into grouping by weeks, I have 52 * numbers_of_years items. And this case causes performance issue. On the timeline below the "empty" weeks have symbol with opacity = 0, only those with any data are visible. But, as I've mentioned previously, all items are rendered in DOM, even if they are not visible. 
----------------------------------------------------------------
This is an automated message from the Apache Git Service.
To respond to the message, please log on to GitHub and use the
URL above to go to the specific comment.

For queries about this service, please contact Infrastructure at:
[email protected]


With regards,
Apache Git Services

---------------------------------------------------------------------
To unsubscribe, e-mail: [email protected]
For additional commands, e-mail: [email protected]