JinyJose commented on issue #13077:
URL:
https://github.com/apache/incubator-echarts/issues/13077#issuecomment-699605397
Hi, In the example https://codepen.io/jinyjs/pen/ZEWRRBQ , there are two charts (chart1 and chart2) which have the toolbox Options and uses the connect function. _echarts.connect([chart1, chart2]);_ Both charts have different data as well. 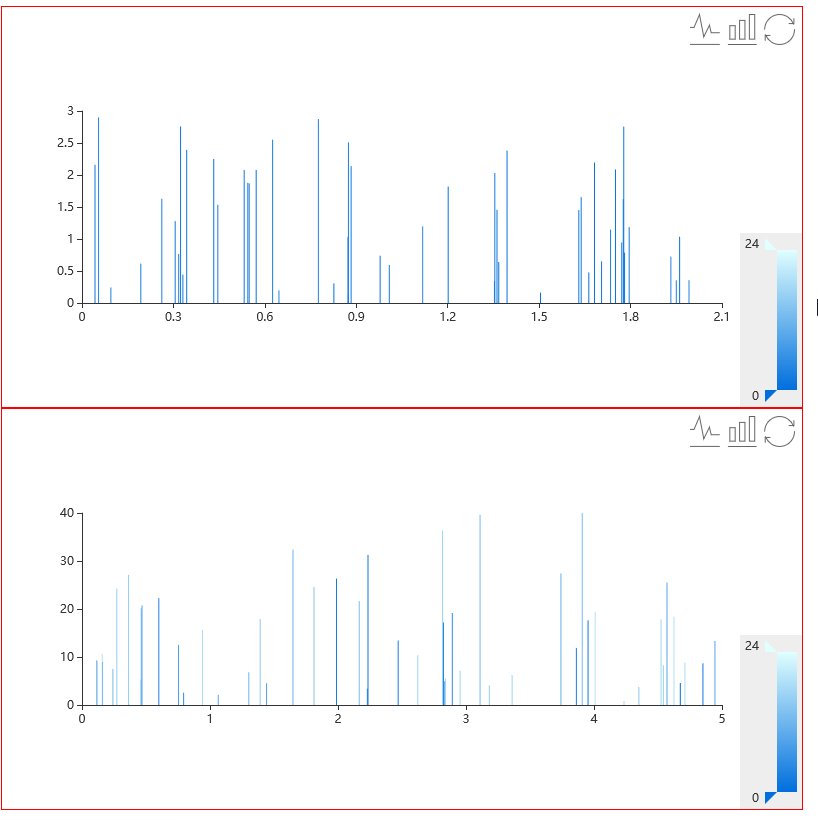 But if the 'Line' Toolbox Option of the first chart is clicked, then the data from the first chart is being displayed in the second chart as well. 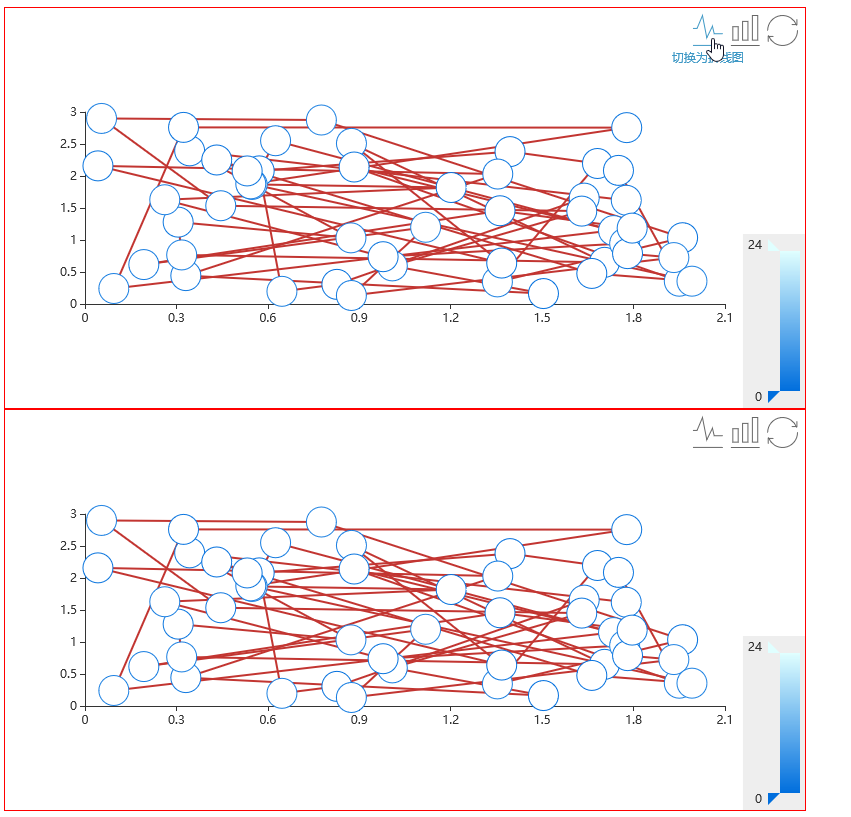 The expected result would be that both charts display line charts with its own dataset. I hope the issue is clear. Please let me know if I can help further. Best regards, Jiny ---------------------------------------------------------------- This is an automated message from the Apache Git Service. To respond to the message, please log on to GitHub and use the URL above to go to the specific comment. For queries about this service, please contact Infrastructure at: [email protected] --------------------------------------------------------------------- To unsubscribe, e-mail: [email protected] For additional commands, e-mail: [email protected]