RomanOlegovich opened a new issue #15391:
URL: https://github.com/apache/echarts/issues/15391
### Version
5.0.2
### Steps to reproduce
Click on a point and start moving the chart (or scale).
```
myChart.setOption({
series:[{
type: 'line',
symbolSize: 0.1,
emphasis: {
scale: true,
lineStyle: {
width: 1,
},
},
lineStyle: {
width: 1,
},
data: Array.from(new Array(100)).map((x, i) => [i,
Math.floor(Math.random() * (10 - 1 1)) 1]),
}],
xAxis:[{type:'value'}],
yAxis:[{type:'value'}],
tooltip: {
trigger: 'axis',
},
dataZoom: [{
type: 'inside',
}]
})
```
### What is expected?
Old points are cleared.
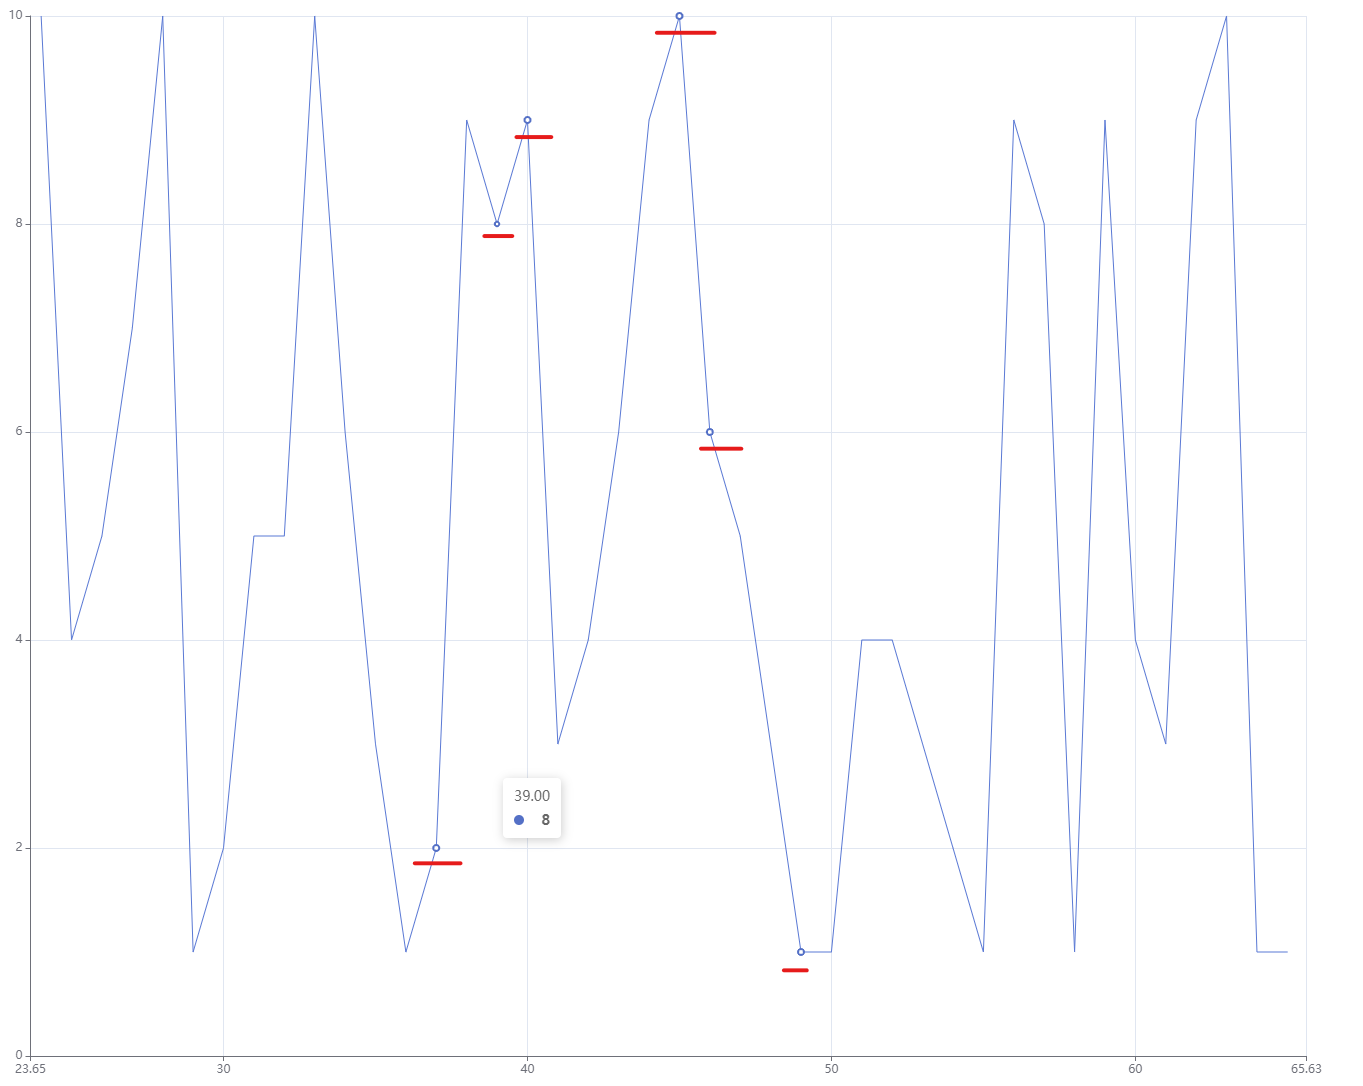
### What is actually happening?
Old points aren't cleared.
<!-- This issue is generated by echarts-issue-helper. DO NOT REMOVE -->
<!-- This issue is in English. DO NOT REMOVE -->
--
This is an automated message from the Apache Git Service.
To respond to the message, please log on to GitHub and use the
URL above to go to the specific comment.
To unsubscribe, e-mail: [email protected]
For queries about this service, please contact Infrastructure at:
[email protected]
---------------------------------------------------------------------
To unsubscribe, e-mail: [email protected]
For additional commands, e-mail: [email protected]