helgasoft opened a new issue #15969:
URL: https://github.com/apache/echarts/issues/15969
### Version 5.2.1 ### Reproduction link [https://codepen.io/helgasoft/pen/OJjggqN](https://codepen.io/helgasoft/pen/OJjggqN) ### Steps to reproduce build a geoJson map of the world with two series ### What is expected? heatmap series points to display beyond map's edge, like the scatter series. Also expected is [scatter clip](https://echarts.apache.org/en/option.html#series-scatter.clip) to work on maps, but it does not. ### What is actually happening? heatmap series are cut off at map's boundary 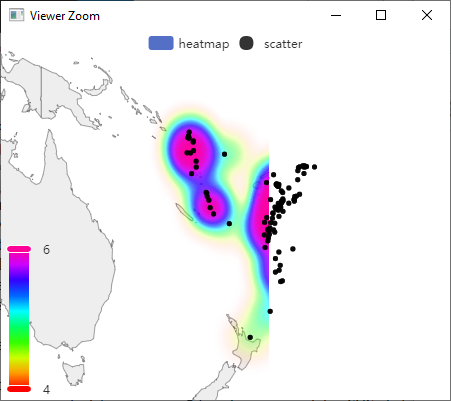 --- I like the logic behind the scatter series. Those geoJson maps are rectangles, but the globe does not just stop at some edge. So it makes sense to plot points beyond the map's boundaries. Would be great if both _heatmap_ and _scatter_ series had a **working clip feature on maps** ! <!-- This issue is generated by echarts-issue-helper. DO NOT REMOVE --> <!-- This issue is in English. DO NOT REMOVE --> -- This is an automated message from the Apache Git Service. To respond to the message, please log on to GitHub and use the URL above to go to the specific comment. To unsubscribe, e-mail: [email protected] For queries about this service, please contact Infrastructure at: [email protected] --------------------------------------------------------------------- To unsubscribe, e-mail: [email protected] For additional commands, e-mail: [email protected]