echarts-bot[bot] commented on issue #16233:
URL: https://github.com/apache/echarts/issues/16233#issuecomment-995350758
@XiaoHH-XiaoHH It seems you are not using English, I've helped translate the content automatically. To make your issue understood by more people and get helped, we'd like to suggest using English next time. 🤗 <details><summary><b>TRANSLATED</b></summary><br> **TITLE** [Bug] The value of the line graph on the icon of the double line graph is incorrect **BODY** ### Version 5.2.1 ### Link to Minimal Reproduction _No response_ ### Steps to Reproduce 1. Create echarts: 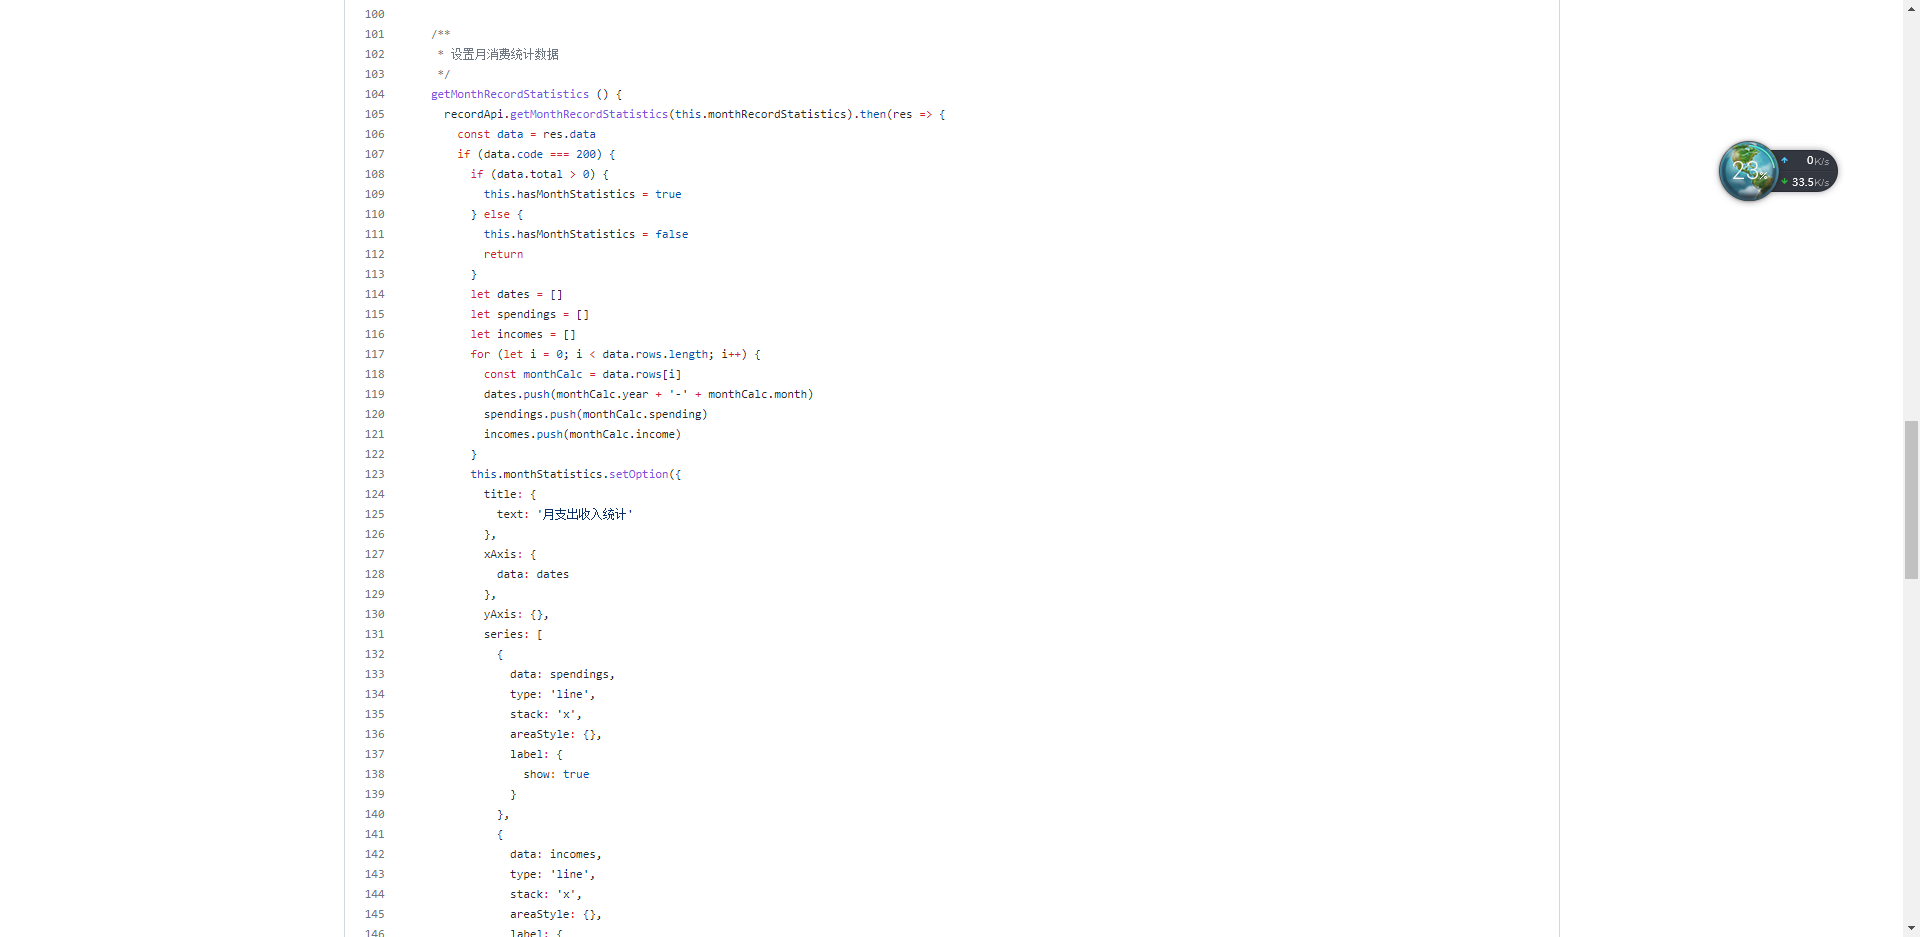 2. The bug screenshot (the string of numbers above does not correspond to the value of the Y axis): 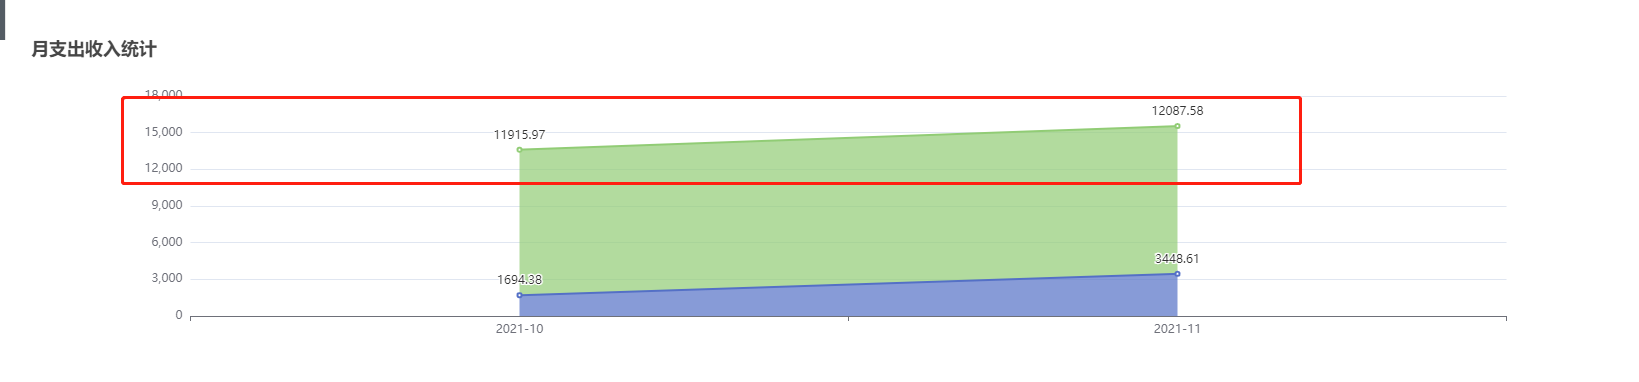 ### Current Behavior The code to create echarts: ```javascript recordApi.getMonthRecordStatistics(this.monthRecordStatistics).then(res => { const data = res.data if (data.code === 200) { if (data.total> 0) { this.hasMonthStatistics = true } else { this.hasMonthStatistics = false return } let dates = [] let spendings = [] let incomes = [] for (let i = 0; i <data.rows.length; i++) { const monthCalc = data.rows[i] dates.push(monthCalc.year +'-' + monthCalc.month) spendings.push(monthCalc.spending) incomes.push(monthCalc.income) } this.monthStatistics.setOption({ title: { text:'Monthly expenditure income statistics' }, xAxis: { data: dates }, yAxis: {}, series: [ { data: spendings, type:'line', stack:'x', areaStyle: {}, label: { show: true } }, { data: incomes, type:'line', stack:'x', areaStyle: {}, label: { show: true } } ] }) } else { this.$message.error(data.message) this.hasMonthStatistics = false } }) ``` Example of the data returned by the server (res at the top): ```json {"total":2,"rows":[{"monthStatisticsId":1,"userId":1,"year":2021,"month":10,"spending":"1694.38","income":" 11915.97","createTime":"2021-11-01T09:00:00"},{"monthStatisticsId":2,"userId":1,"year":2021,"month":11,"spending":" 3448.61","income":"12087.58","createTime":"2021-12-01T01:00:00"}],"code":200,"message":"Query successful"} ``` ### Expected Behavior I hope that the numbers on the chart displayed are consistent with the numbers on the Y-axis coordinates ### Environment ```markdown -OS: Server: Linux7.9+nginx1.20.1, Client: Windows10 -Browser:chrome -Framework:vue2+elementui+echarts ``` ### Any additional comments? _No response_ </details> -- This is an automated message from the Apache Git Service. To respond to the message, please log on to GitHub and use the URL above to go to the specific comment. To unsubscribe, e-mail: [email protected] For queries about this service, please contact Infrastructure at: [email protected] --------------------------------------------------------------------- To unsubscribe, e-mail: [email protected] For additional commands, e-mail: [email protected]