piscesvivian opened a new issue #16487:
URL: https://github.com/apache/echarts/issues/16487
### What problem does this feature solve? 在算法数据分析中,论文里面会经常用到一种图,seaborn已经有实现,但是ECharts不清楚该如何去绘制 形如: 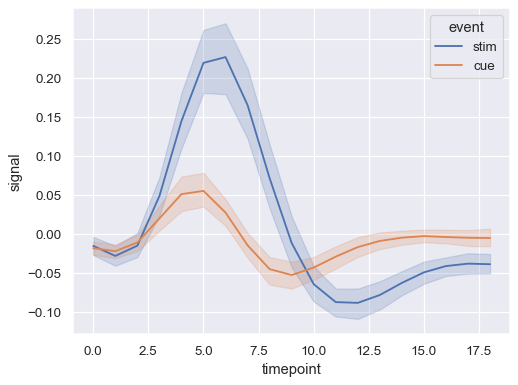 show the mean and 95% confidence interval 而且可以平滑平均线 具体图绘制示例如seaborn lineplot文档: http://seaborn.pydata.org/generated/seaborn.lineplot.html ### What does the proposed API look like? 我们能提供一类:type: lineplot 的绘制方法吗? -- This is an automated message from the Apache Git Service. To respond to the message, please log on to GitHub and use the URL above to go to the specific comment. To unsubscribe, e-mail: [email protected] For queries about this service, please contact Infrastructure at: [email protected] --------------------------------------------------------------------- To unsubscribe, e-mail: [email protected] For additional commands, e-mail: [email protected]