spoojaj opened a new issue #16541:
URL: https://github.com/apache/echarts/issues/16541
### Version 5.3.0 ### Link to Minimal Reproduction _No response_ ### Steps to Reproduce 1. Create the chart with realtime data and xaxis is time axis. 2. Add minor ticks to xaxis. 3. look for minor ticks. ### Current Behavior 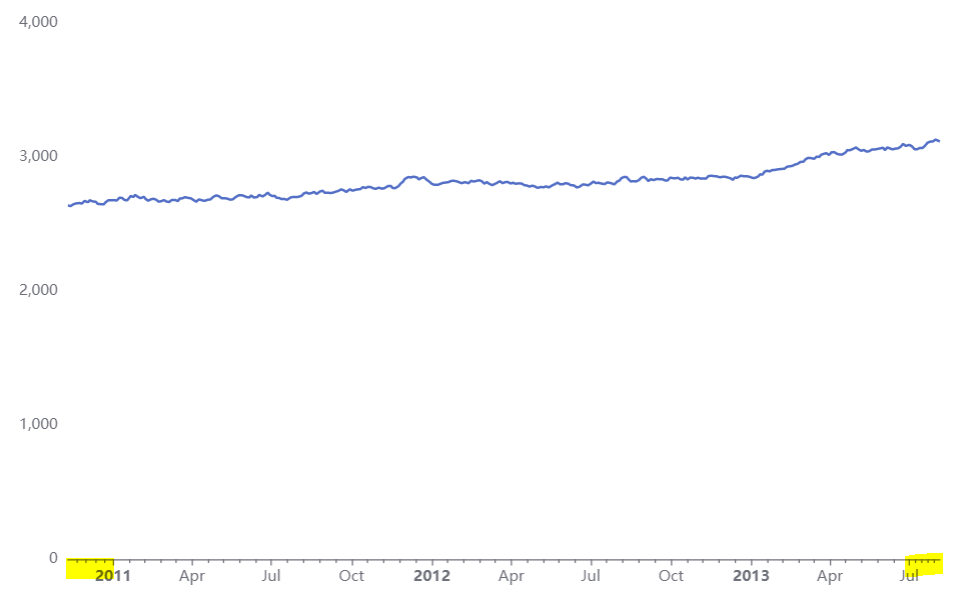 Highlighted part is where the ticks are adjusted in compromised position. Ideally should be spread similar to rest of intervals. ### Expected Behavior 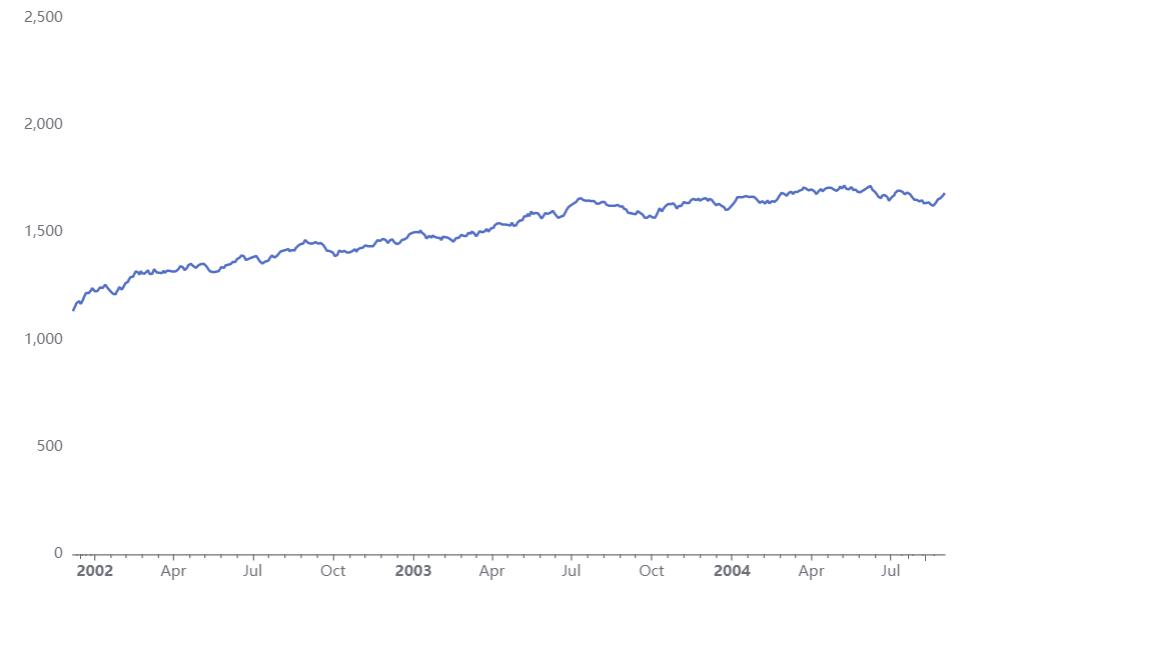 Expected Behavior. ### Environment ```markdown - OS: - Browser: - Framework: ``` ### Any additional comments? Please check the example below. function randomData() { now = new Date(+now + oneDay); value = value + Math.random() * 21 - 10; return { name: now.toString(), value: [ [now.getFullYear(), now.getMonth() + 1, now.getDate()].join('/'), Math.round(value) ] }; } let data = []; let now = new Date(1997, 9, 3); let oneDay = 24 * 3600 * 1000; let value = Math.random() * 1000; for (var i = 0; i < 1000; i++) { data.push(randomData()); } option = { xAxis: { type: 'time', splitLine: { show: false }, minorTick: { show: true, } }, yAxis: { type: 'value', boundaryGap: [0, '100%'], splitLine: { show: false } }, series: [ { name: 'Fake Data', type: 'line', showSymbol: false, data: data } ] }; setInterval(function () { for (var i = 0; i < 5; i++) { data.shift(); data.push(randomData()); } myChart.setOption({ series: [ { data: data } ] }); }, 1000); -- This is an automated message from the Apache Git Service. To respond to the message, please log on to GitHub and use the URL above to go to the specific comment. To unsubscribe, e-mail: [email protected] For queries about this service, please contact Infrastructure at: [email protected] --------------------------------------------------------------------- To unsubscribe, e-mail: [email protected] For additional commands, e-mail: [email protected]