guchengjie opened a new issue #16627:
URL: https://github.com/apache/echarts/issues/16627
### Version 5.3 ### Link to Minimal Reproduction https://echarts.apache.org/examples/zh/editor.html?c=line-simple ### Steps to Reproduce 1.[打开官网](https://echarts.apache.org/examples/zh/editor.html?c=line-simple) 2. 输入`option = { xAxis: { type: 'category', data: ['Mon', 'Tue', 'Wed', 'Thu', 'Fri', 'Sat', 'Sun'] }, yAxis: { type: 'value' }, series: [ { data: [150, 230, 224, 218, 135, 147, 260], type: 'line', areaStyle: { opacity: 0.8, color: new echarts.graphic.LinearGradient(0, 0, 0, 1, [{ offset: 0, color: 'rgb(136, 193, 250, 1)' }, { offset: 1, color: 'rgb(255, 255, 255, 0)' } ]) } } ] };` 3.打开调试工具,就会出现报错 ### Current Behavior 出现报错,并且多次触发 ### Expected Behavior 正常运行 ### Environment ```markdown - OS:win10 - Browser:chrome 98 - Framework:react,webpack ``` ### Any additional comments? 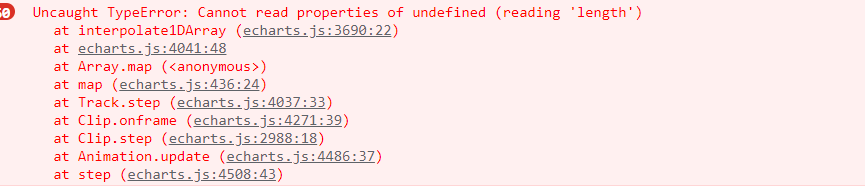 -- This is an automated message from the Apache Git Service. To respond to the message, please log on to GitHub and use the URL above to go to the specific comment. To unsubscribe, e-mail: [email protected] For queries about this service, please contact Infrastructure at: [email protected] --------------------------------------------------------------------- To unsubscribe, e-mail: [email protected] For additional commands, e-mail: [email protected]