echarts-bot[bot] commented on issue #16668:
URL: https://github.com/apache/echarts/issues/16668#issuecomment-1064873833
@sunxia628 It seems you are not using English, I've helped translate the content automatically. To make your issue understood by more people and get helped, we'd like to suggest using English next time. 🤗 <details><summary><b>TRANSLATED</b></summary><br> **TITLE** [Feature] What kind of legend is used for geographic profiles of the oil industry? **BODY** ### What problem does this feature solve? Deviation diagram similar to [https://www.int.com/geotoolkit-demos/deviated-schematics/] legend, which legend is used? My prototype diagram is as follows: 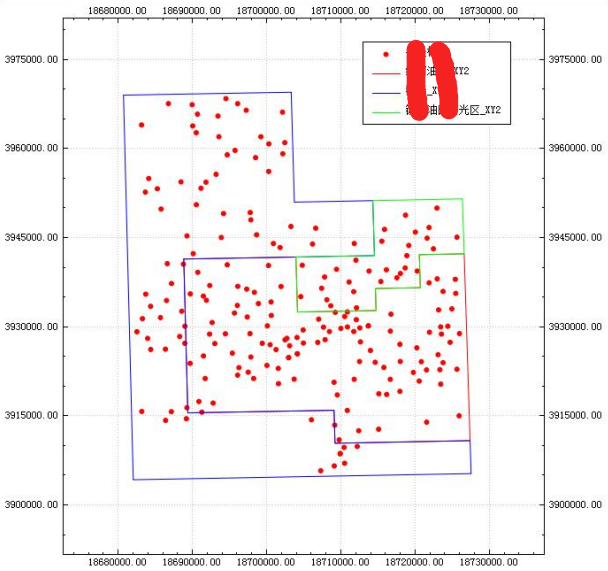  In echarts' example, it seems that no suitable solution can be found ### What does the proposed API look like? Do you know which of the existing echarts legends is more suitable for the oil industry's point map and geographic profile map? If there is no suitable legend, there is no such development plan in the future, thank you! </details> -- This is an automated message from the Apache Git Service. To respond to the message, please log on to GitHub and use the URL above to go to the specific comment. To unsubscribe, e-mail: [email protected] For queries about this service, please contact Infrastructure at: [email protected] --------------------------------------------------------------------- To unsubscribe, e-mail: [email protected] For additional commands, e-mail: [email protected]