activeSugandha opened a new issue, #16890:
URL: https://github.com/apache/echarts/issues/16890
### Version 5.3.1 ### Link to Minimal Reproduction https://echarts.apache.org/examples/en/editor.html ### Steps to Reproduce 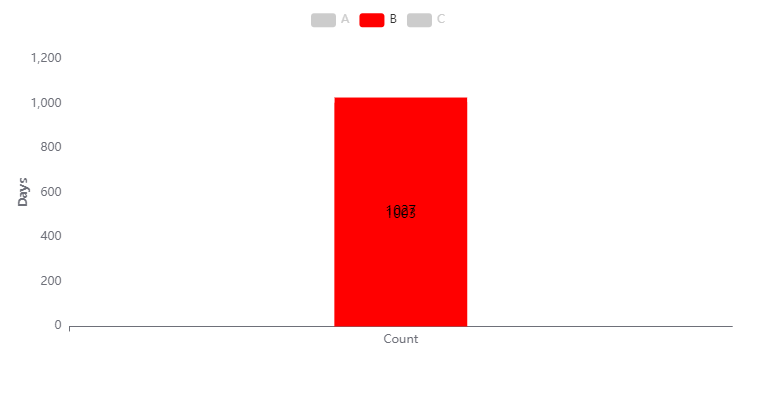 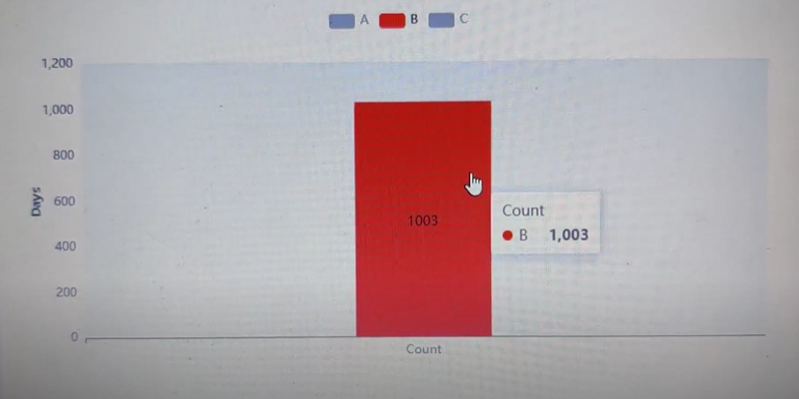 option = { tooltip: { trigger: 'axis', axisPointer: { type: 'shadow' } }, legend: { top: '2%', data: ['A', 'B', 'C'] }, grid: { left: '5%', right: '4%', bottom: '25%', containLabel: true }, yAxis: { type: 'value', name: 'Days', nameLocation: 'middle', nameTextStyle: { fontSize: 12, fontWeight: 'bold', }, nameGap: 40, splitLine: { show: false } }, xAxis: { type: 'category', data: ['Count'], nameTextStyle: { fontSize: 9, fontWeight: 'bold', }, nameGap: 25, axisPointer: { type: 'shadow' } }, series: [ { name: 'A', type: 'bar', barWidth: '20%', stack: 'A', label: { show: true, color: '#000000', position: 'inside', fontSize: 13, fontWeight: 500 }, data: [25,1] }, { name: 'B', type: 'bar', barWidth: '20%', stack: 'A', label: { show: true, color: '#000000', position: 'inside', fontSize: 13, fontWeight: 500 }, data: [1003,1027] }, { name: 'C', type: 'bar', barWidth: '20%', stack: 'A', label: { show: true, color: '#000000', position: 'inside', fontSize: 13, fontWeight: 500 }, data: [5,7] } ], color: ['#4B8B3B', '#FF0000', '#808080'] }; ### Current Behavior Values are overlapping on graphs when click outside the graph and if click inside graph area, we are able to see only one value. Also in tooltip getting only one value. Here I'm trying to create three Bar graphs separately which we can check on clicking legends but the problem I'm facing is values overlapping. As requirement is to make x-axis dataset dynamic which may be one, two or so on similarly data may be [1,1,1] or so on. ### Expected Behavior Graph should pick single value each time it should not overlap. if we have 2 dataset on x-axis then only it will pick the second value. eg: case 1: xAxis: data: ['Count'] Series: A- data [23,67] B - data[50,64] C - data[12,0] Result on Graph : A - 23 B - 50 C - 12 Case 2: xAxis: data: ['Count', 'Sum'] Series: A- data [23,67] B - data[50,64] C - data[12,0] Result on Graph: A - 23, 67 B - 50, 64 C - 12,0 ### Environment ```markdown - OS: - Browser: - Framework: ``` ### Any additional comments? _No response_ -- This is an automated message from the Apache Git Service. To respond to the message, please log on to GitHub and use the URL above to go to the specific comment. To unsubscribe, e-mail: [email protected] For queries about this service, please contact Infrastructure at: [email protected] --------------------------------------------------------------------- To unsubscribe, e-mail: [email protected] For additional commands, e-mail: [email protected]