elenzio9 opened a new issue, #17103:
URL: https://github.com/apache/echarts/issues/17103
### Version 5.3.2 ### Link to Minimal Reproduction _No response_ ### Steps to Reproduce 1. Load echarts 2. Use Basic Parallel Graph ### Current Behavior According to the documentation, the default value of `axisLabel.show` is true. However, setting it to false to prevent the axis label from appearing seems to have no effect. I added the code bellow to the [online example:](https://echarts.apache.org/examples/zh/editor.html?c=parallel-simple) ``` option = { parallelAxis: [ { dim: 0, name: 'Price' }, { dim: 1, name: 'Net Weight' }, { dim: 2, name: 'Amount', axisTick: { show: false }, axisLine: { show: false }, axisLabel: { show: false } } ], series: { type: 'parallel', lineStyle: { width: 4 }, data: [ [12.99, 100, 82], [9.99, 80, 77], [20, 120, 60] ] } }; ``` and it has the following effect: 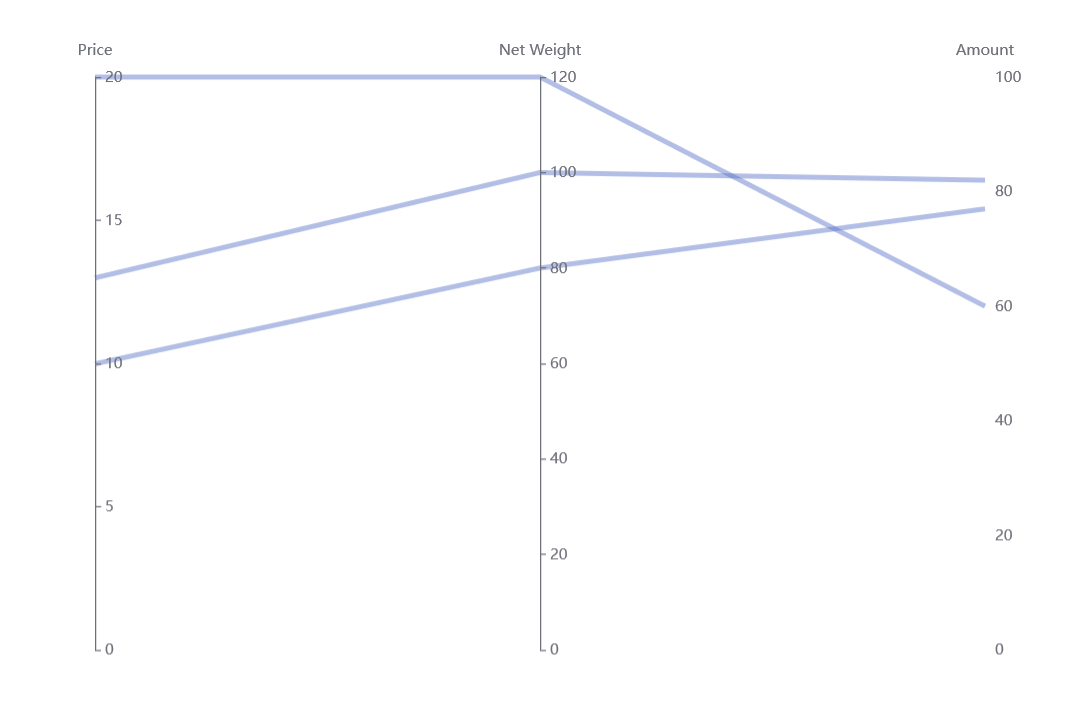 ### Expected Behavior The expected behavior would be for the axis label to disappear as is the case with axis ticks and line. ### Environment ```markdown - OS: - Browser: - Framework: ``` ### Any additional comments? _No response_ -- This is an automated message from the Apache Git Service. To respond to the message, please log on to GitHub and use the URL above to go to the specific comment. To unsubscribe, e-mail: [email protected] For queries about this service, please contact Infrastructure at: [email protected] --------------------------------------------------------------------- To unsubscribe, e-mail: [email protected] For additional commands, e-mail: [email protected]