echarts-bot[bot] commented on issue #17145:
URL: https://github.com/apache/echarts/issues/17145#issuecomment-1144265380
@biankaiwen111 It seems you are not using English, I've helped translate the
content automatically. To make your issue understood by more people and get
helped, we'd like to suggest using English next time. 🤗
<details><summary><b>TRANSLATED</b></summary><br>
**TITLE**
[Bug] Heat maps produce blank images in the case of some legitimate data
**BODY**
### Version
5.2.2 and before
### Link to Minimal Reproduction
_No response_
### Steps to Reproduce
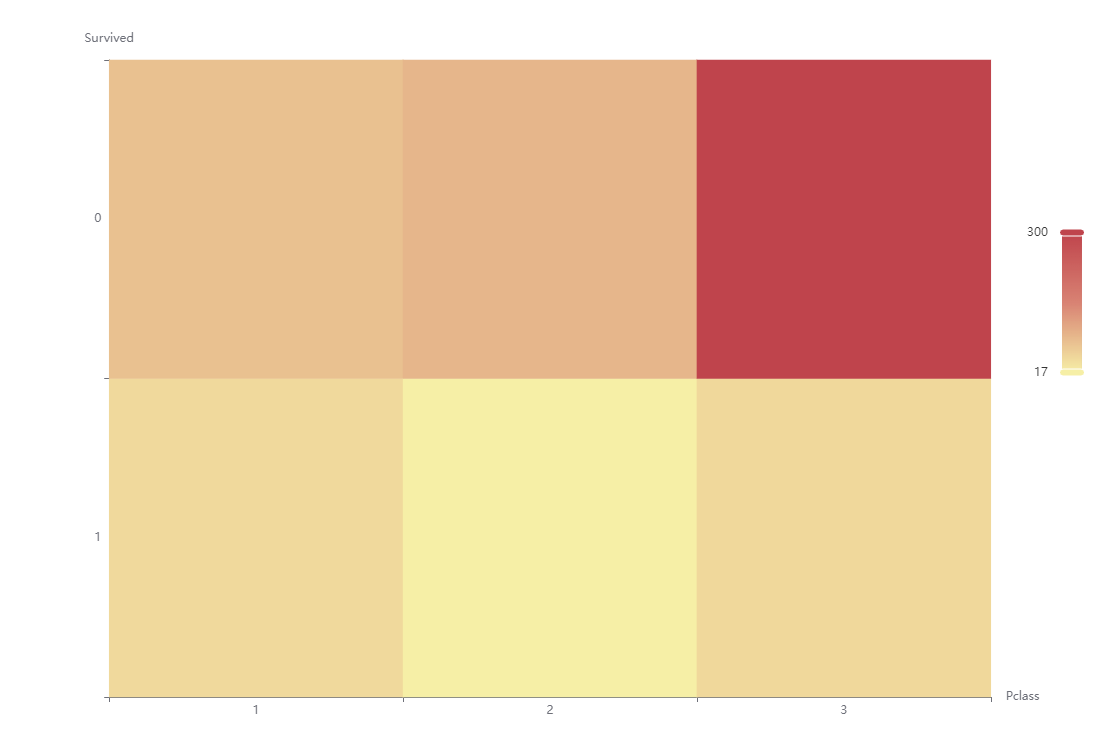
For the following settings, the heatmap can be drawn correctly
````
option={
"dataset": [
{
"id": "raw",
"dimensions": [
"Survived",
"Pclass",
"CountOfRecords",
"Gender"
],
"source": [
[1, 3, 47, "male"],
[1, 2, 17, "male"],
[1, 1, 45, "male"],
[0, 3, 300, "male"],
[0, 2, 91, "male"],
[0, 1, 77, "male"]
]
},
{
"fromDatasetIndex": 0,
"id": "sorting",
"transform": {
"type": "sort",
"config": {
"dimension": "Pclass",
"order": "asc"
}
}
}
],
"xAxis": {
"type": "category",
"name": "Pclass",
},
"yAxis": {
"type": "category",
"name": "Survived",
},
"series": [
{
"type": "heatmap",
"datasetIndex": 1,
"encode": {
"x": "Pclass",
"y": "Survived"
}
}
],
"visualMap": [
{
"dimension": "CountOfRecords",
"min": 17,
"max": 300,
"calculable": true,
"orient": "vertical",
"bottom": "50%",
"right": "1%"
}
]
}
````
But when I exchanged two columns in the original data (exchanged "Gender" to
the first column), the heat map could not be drawn. Here, the x and y axes are
confirmed by the column names.
````
option={
"dataset": [
{
"id": "raw",
"dimensions": [
"Gender",
"Survived",
"Pclass",
"CountOfRecords"
],
"source": [
["male", 1, 3, 47],
["male", 1, 2, 17],
["male", 1, 1, 45],
["male", 0, 3, 300],
["male", 0, 2, 91],
["male", 0, 1, 77]
]
},
{
"fromDatasetIndex": 0,
"id": "sorting",
"transform": {
"type": "sort",
"config": {
"dimension": "Pclass",
"order": "asc"
}
}
}
],
"xAxis": {
"type": "category",
"name": "Pclass",
},
"yAxis": {
"type": "category",
"name": "Survived",
},
"series": [
{
"type": "heatmap",
"datasetIndex": 1,
"encode": {
"x": "Pclass",
"y": "Survived"
}
}
],
"visualMap": [
{
"dimension": "CountOfRecords",
"min": 17,
"max": 300,
"calculable": true,
"orient": "vertical",
"bottom": "50%",
"right": "1%"
}
]
}
````
### Current Behavior
Heatmap result is empty
### Expected Behavior
The heatmap should still draw the image correctly
### Environment
````markdown
- OS: macOS
- Browser: Chrome
- Framework:
````
### Any additional comments?
_No response_
</details>
--
This is an automated message from the Apache Git Service.
To respond to the message, please log on to GitHub and use the
URL above to go to the specific comment.
To unsubscribe, e-mail: [email protected]
For queries about this service, please contact Infrastructure at:
[email protected]
---------------------------------------------------------------------
To unsubscribe, e-mail: [email protected]
For additional commands, e-mail: [email protected]