shadabumer opened a new issue, #17186:
URL: https://github.com/apache/echarts/issues/17186
### Version
5.2.1
### Link to Minimal Reproduction
_No response_
### Steps to Reproduce
**_index.html_**
```
<!DOCTYPE html>
<html lang="en">
<head>
<meta charset="utf-8">
<title>Area Pieces - Apache ECharts Demo</title>
<link rel="stylesheet" href="./style.css">
</head>
<body>
<div id="chart-container"></div>
<script
src="https://fastly.jsdelivr.net/npm/[email protected]/dist/echarts.min.js";></script>
<script src="./index.js"></script>
</body>
</html>
```
**_index.js_**
```
var dom = document.getElementById("chart-container");
var myChart = echarts.init(dom, null, {
renderer: "canvas",
useDirtyRect: false
});
var app = {};
var option;
option = {
xAxis: {
type: "time",
boundaryGap: false
},
yAxis: {
type: "value",
boundaryGap: [0, "30%"]
},
visualMap: {
type: "piecewise",
show: false,
dimension: 0,
seriesIndex: 0,
pieces: [
{
gt: 1,
lt: 3,
color: "rgba(0, 0, 180, 0.4)"
},
{
gt: 5,
lt: 7,
color: "rgba(0, 0, 180, 0.4)"
}
]
},
series: [
{
type: "line",
smooth: 0,
symbol: "none",
lineStyle: {
color: "#5470C6",
width: 5
},
markLine: {
symbol: ["none", "none"],
label: { show: false },
data: [{ xAxis: 1 }, { xAxis: 3 }, { xAxis: 5 }, { xAxis: 7 }]
},
areaStyle: {},
data: [
["2022-05-31 17:25:00+05:30", 19],
["2022-05-31 17:30:00+05:30", 29],
["2022-05-31 17:35:00+05:30", 39],
["2022-05-31 17:40:00+05:30", 49],
["2022-05-31 17:45:00+05:30", 19],
["2022-05-31 17:50:00+05:30", 19],
["2022-05-31 17:55:00+05:30", 19],
["2022-05-31 18:00:00+05:30", 19],
["2022-05-31 18:05:00+05:30", 19],
["2022-05-31 18:10:00+05:30", 19],
["2022-05-31 18:15:00+05:30", 19]
]
}
]
};
if (option && typeof option === "object") {
myChart.setOption(option);
}
window.addEventListener("resize", myChart.resize);
```
Here in the series data, along with date and time, timezone (+05:30) is also
provided.
### Current Behavior
The chart plotted against the data is skewed by 30 mins.
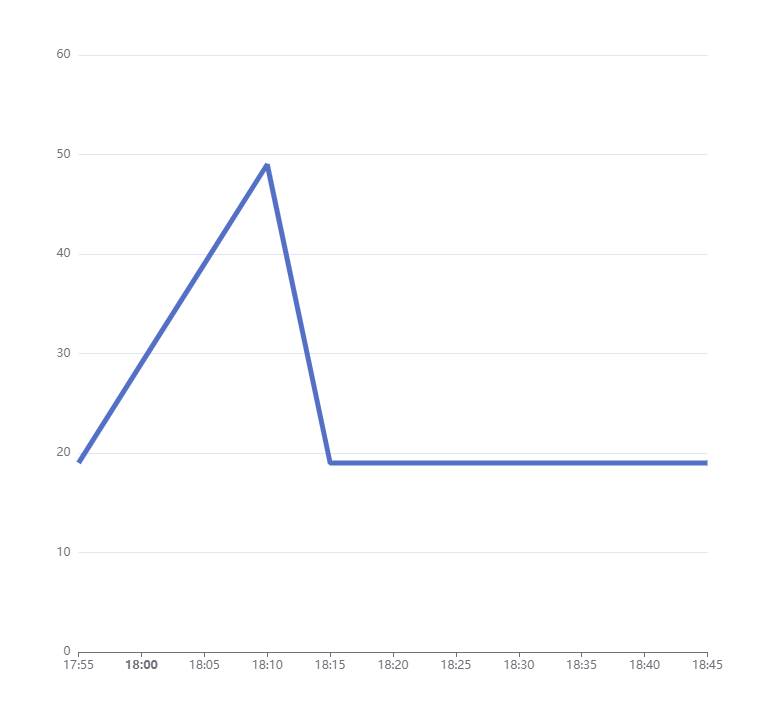
### Expected Behavior
Users expect the chart to start the plotting from 17:25 but it begins at
17:55 and is expected to end at 18:15 but ends at 18:45.
### Environment
```markdown
- OS: Windows
- Browser: Chrome
- Framework: Vanilla JS, Angular@11
```
### Any additional comments?
_No response_
--
This is an automated message from the Apache Git Service.
To respond to the message, please log on to GitHub and use the
URL above to go to the specific comment.
To unsubscribe, e-mail: [email protected]
For queries about this service, please contact Infrastructure at:
[email protected]
---------------------------------------------------------------------
To unsubscribe, e-mail: [email protected]
For additional commands, e-mail: [email protected]