srinathmerugu opened a new issue, #17686:
URL: https://github.com/apache/echarts/issues/17686
### What problem does this feature solve? I'm trying to plot a bubble chart using echarts v5.3.3, after the bubble chart has rendered, observed bubble is exceeding the axis line as shown below 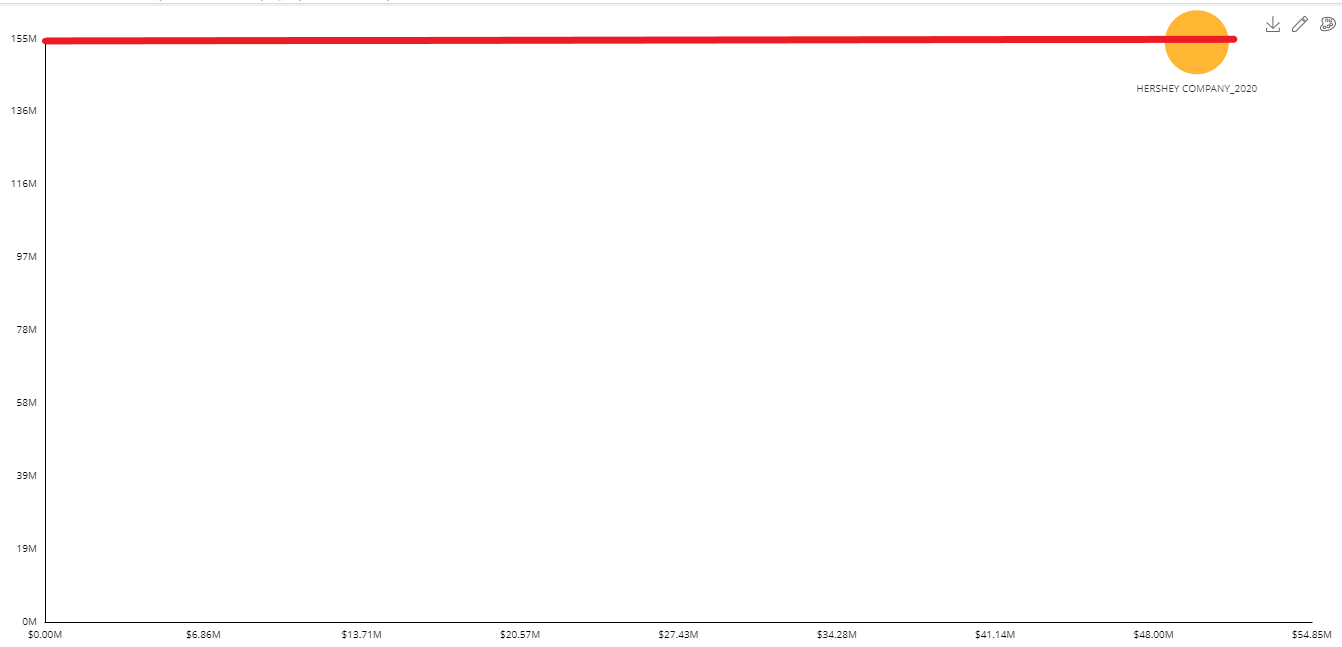 ### What does the proposed API look like? Expected behavior is to cut off the bubble when it exceeds the axis line as shown below. Is there any way/option to know bubble x&y coordinates before the chart has rendered and to cut off the bubble when it crosses axis line. 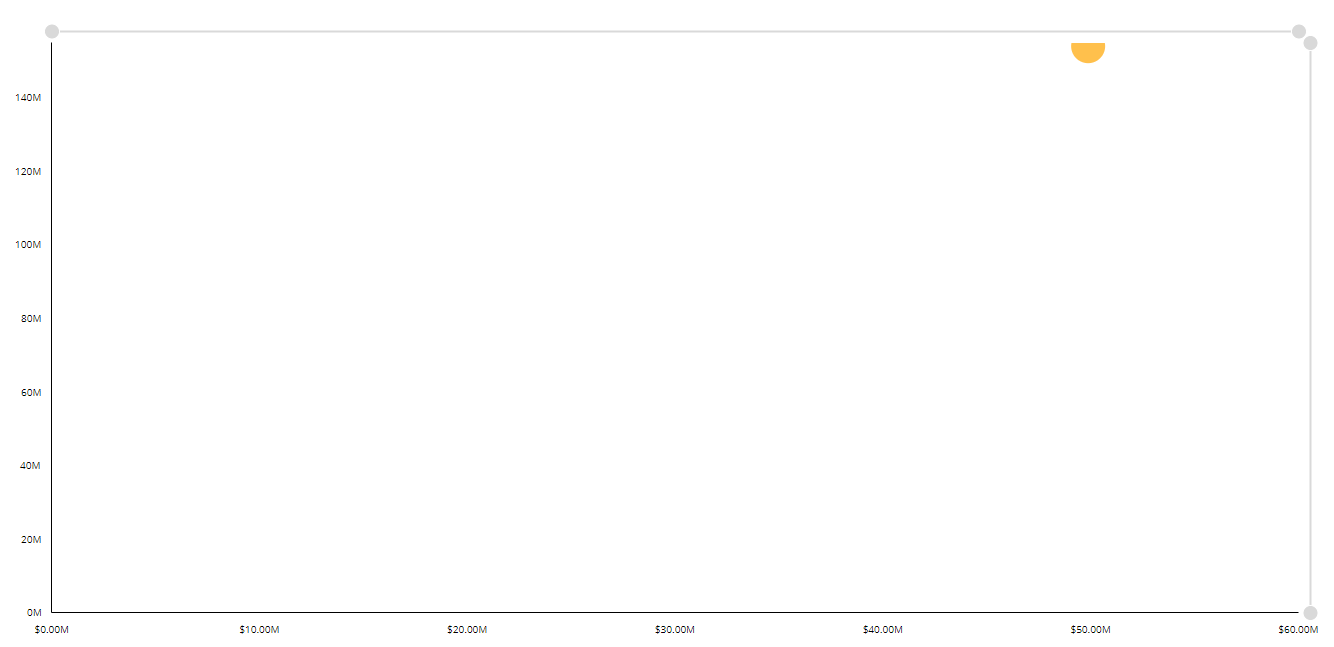 -- This is an automated message from the Apache Git Service. To respond to the message, please log on to GitHub and use the URL above to go to the specific comment. To unsubscribe, e-mail: [email protected] For queries about this service, please contact Infrastructure at: [email protected] --------------------------------------------------------------------- To unsubscribe, e-mail: [email protected] For additional commands, e-mail: [email protected]