echarts-bot[bot] commented on issue #17910:
URL: https://github.com/apache/echarts/issues/17910#issuecomment-1313064305
@li-guanlong It seems you are not using English, I've helped translate the content automatically. To make your issue understood by more people and get helped, we'd like to suggest using English next time. 🤗 <details><summary><b>TRANSLATED</b></summary><br> **TITLE** [Bug] When the mouse hovers over the chart line, the line disappears **BODY** ### Version 5.3.0 ### Link to Minimal Reproduction _No response_ ### Steps to Reproduce 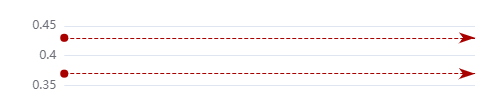 After the mouse hovers up: 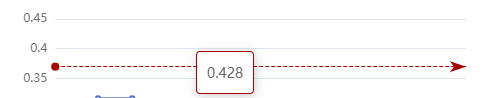 ### Current Behavior Configuration code: `{ data: [{ yAxis: 0.428 }, { yAxis: 0.372 }], label: { show: false, formatter: (value) => { return value.data.yAxis }, silent: true, position: 'insideEndBottom' }, lineStyle: { color: 'rgb(169 0 0 )' }, tooltip: { formatter: (value) => { return value.data.yAxis + '' } } }` ### Expected Behavior How to configure so that the line suspension state does not disappear ### Environment ```markdown - OS: - Browser: - Framework: ``` ### Any additional comments? _No response_ </details> -- This is an automated message from the Apache Git Service. To respond to the message, please log on to GitHub and use the URL above to go to the specific comment. To unsubscribe, e-mail: [email protected] For queries about this service, please contact Infrastructure at: [email protected] --------------------------------------------------------------------- To unsubscribe, e-mail: [email protected] For additional commands, e-mail: [email protected]