echarts-bot[bot] commented on issue #17973:
URL: https://github.com/apache/echarts/issues/17973#issuecomment-1326951672
@wyx-scottwu It seems you are not using English, I've helped translate the content automatically. To make your issue understood by more people and get helped, we'd like to suggest using English next time. 🤗 <details><summary><b>TRANSLATED</b></summary><br> **TITLE** [Bug] datazoom-inside rendering error **BODY** ### Version 4.9.6 ### Link to Minimal Reproduction _No response_ ### Steps to Reproduce Operation: After configuring dataZoom-inside, operate the mac touchpad to make it zoom, and render errors after zooming in and restoring Error rendering: 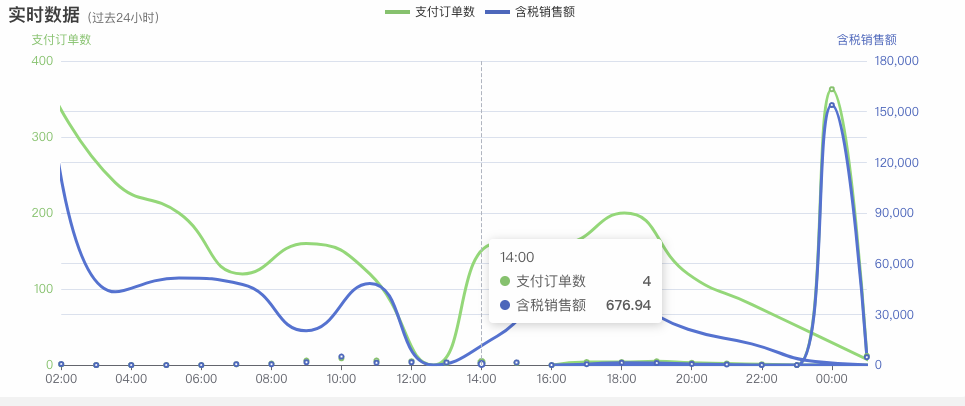 Normal rendering rendering:  My option configuration: ```json { "color": [ "#90cb75", "#5470c6" ], "title": { "text": "Real-time data {sub|(last 24 hours)}", "textStyle": { "rich": { "sub": { "color": "#777", "verticalAlign": "bottom" } } } }, "tooltip": { "trigger": "axis" }, "legend": { "data": [ "Number of Payment Orders", "tax-included sales" ], "itemHeight": 4, "icon": "rect" }, "grid": { "left": "3%", "right": "4%", "bottom": "3%", "containLabel": true }, "xAxis": { "type": "category", "boundaryGap": false, "data": [ "02:00", "03:00", "04:00", "05:00", "06:00", "07:00", "08:00", "09:00", "10:00", "11:00", "12:00", "13:00", "14:00", "15:00", "16:00", "17:00", "18:00", "19:00", "20:00", "21:00", "22:00", "23:00", "00:00", "01:00" ] }, "yAxis": [ { "name": "Number of Payment Orders", "type": "value", "nameTextStyle": { "color": "#90cb75", "align": "center" }, "axisLine": { "lineStyle": { "color": "#90cb75" } } }, { "name": "Sales including tax", "type": "value", "nameTextStyle": { "color": "#5470c6", "align": "center" }, "axisLine": { "lineStyle": { "color": "#5470c6" } } } ], "series": [ { "name": "Number of Payment Orders", "type": "line", "stack": "Number of payment orders", "yAxisIndex": 0, "smooth": true, "data": [ 1, 0, 0, 0, 0, 1, 2, 6, 9, 6, 5, 3, 4, 3, 0, 4, 4, 5, 3, 2, 1, 0, 363, 12 ] }, { "name": "Sales including tax", "type": "line", "stack": "Sales including tax", "yAxisIndex": 1, "smooth": true, "data": [ 629.98, 0, 0, 0, 0, 539.98, 526.75, 1698.7, 5047.9, 1445.09, 1719.32, 1590.42, 676.94, 1611.91, 0, 569.14, 1429.93, 1244.91, 706.75, 419.97, 69.99, 0, 153930.42, 4705.73 ] } ], "dataZoom": [ { "start": 0, "type": "inside" } ] } ``` ### Current Behavior Operation: After configuring dataZoom-inside, operate the mac touchpad to make it zoom, and render errors after zooming in and restoring Error rendering:  ### Expected Behavior Correctly render charts after zooming as follows:  ### Environment ```markdown - OS: macOS Monterey 12.6 - Browser: Chrome Version 107.0.5304.110 (Official Release) (arm64) - Framework: [email protected] ``` ### Any additional comments? _No response_ </details> -- This is an automated message from the Apache Git Service. To respond to the message, please log on to GitHub and use the URL above to go to the specific comment. To unsubscribe, e-mail: [email protected] For queries about this service, please contact Infrastructure at: [email protected] --------------------------------------------------------------------- To unsubscribe, e-mail: [email protected] For additional commands, e-mail: [email protected]