rushaidDTS opened a new issue, #18017:
URL: https://github.com/apache/echarts/issues/18017
### Version 5.4.0 ### Link to Minimal Reproduction https://codepen.io/rushaidrilaf/pen/bGKONRj ### Steps to Reproduce 1. There are 3 coordinates defined for data of the option to display in chart. 2. Try to drag the circle points visible in the middle 3. Try to drag the horizontal line 4. Only the horizontal line is dragging 5. Graphical element is not applied to circle at the middle. 6. When trying to return more than one graphical element by mapping through the data some issue occur that we cannot get it work properly. ### Current Behavior 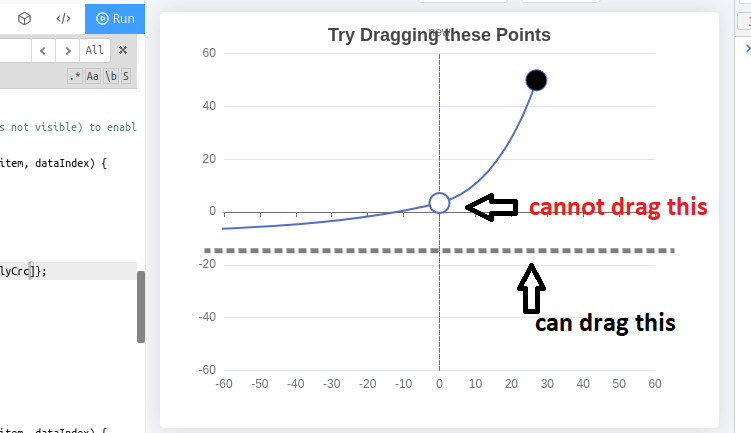 ### Expected Behavior 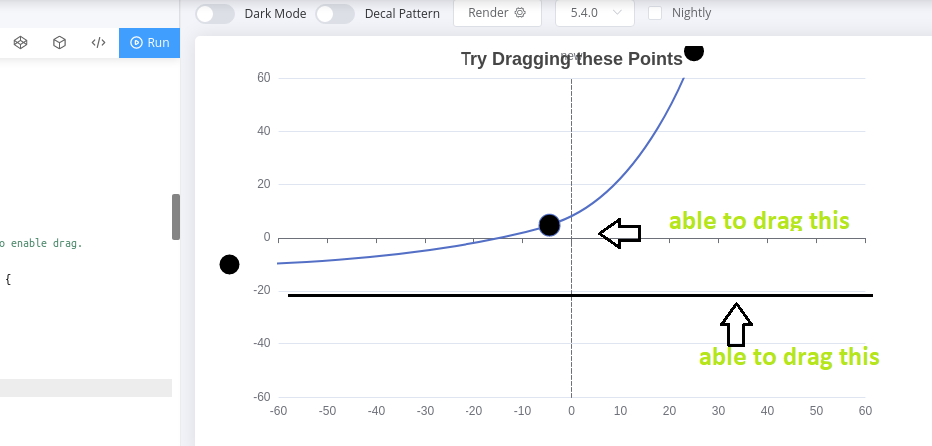 ### Environment ```markdown - OS: - Browser: - Framework: ``` ### Any additional comments? _No response_ -- This is an automated message from the Apache Git Service. To respond to the message, please log on to GitHub and use the URL above to go to the specific comment. To unsubscribe, e-mail: [email protected] For queries about this service, please contact Infrastructure at: [email protected] --------------------------------------------------------------------- To unsubscribe, e-mail: [email protected] For additional commands, e-mail: [email protected]