echarts-bot[bot] commented on issue #18139:
URL: https://github.com/apache/echarts/issues/18139#issuecomment-1372094042
@Break-2020 It seems you are not using English, I've helped translate the content automatically. To make your issue understood by more people and get helped, we'd like to suggest using English next time. 🤗 <details><summary><b>TRANSLATED</b></summary><br> **TITLE** [Feature] The grid lines in the histogram cannot be aligned with the x-axis tick marks and text positions **BODY** ### What problem does this feature solve? My family, I am now encountering the problem of aligning the grid lines. If you change the boundaryGap to false, you can achieve the alignment of the x-axis scale lines, text, and grid lines, but then the columns will run outside the x-axis 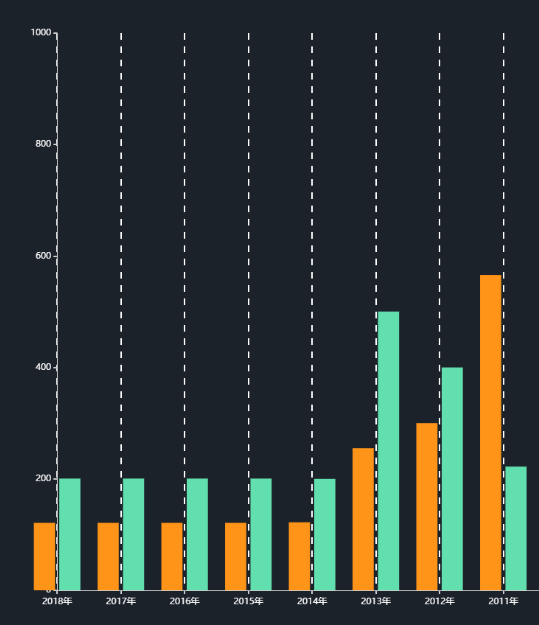 The method of changing the boundaryGap is only applicable to the line chart, and cannot solve the problem in the histogram. For the time being, there is no solution on the Internet that can use splitline to realize the grid line. ### What does the proposed API look like? I hope there is a property to make it automatically aligned </details> -- This is an automated message from the Apache Git Service. To respond to the message, please log on to GitHub and use the URL above to go to the specific comment. To unsubscribe, e-mail: [email protected] For queries about this service, please contact Infrastructure at: [email protected] --------------------------------------------------------------------- To unsubscribe, e-mail: [email protected] For additional commands, e-mail: [email protected]

