manu-sopra opened a new issue, #18248:
URL: https://github.com/apache/echarts/issues/18248
### Version 5.3.3 ### Link to Minimal Reproduction _No response_ ### Steps to Reproduce I am using apache Echart on Angular Project. My requirement was to changes x-min , x-max, y-min, y-max of graph & color and thickness of curve dynamically. But when I try to increase thickness of curve, graph gets distorted and my curves goes out of axis. 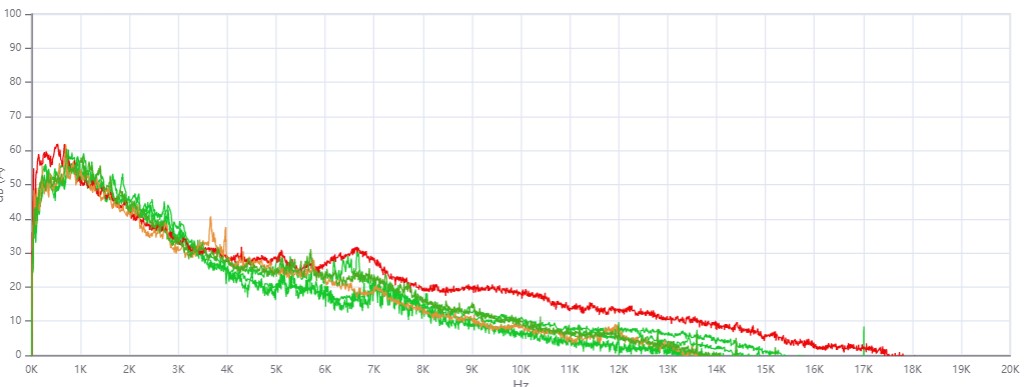 above is my graph before thickness change 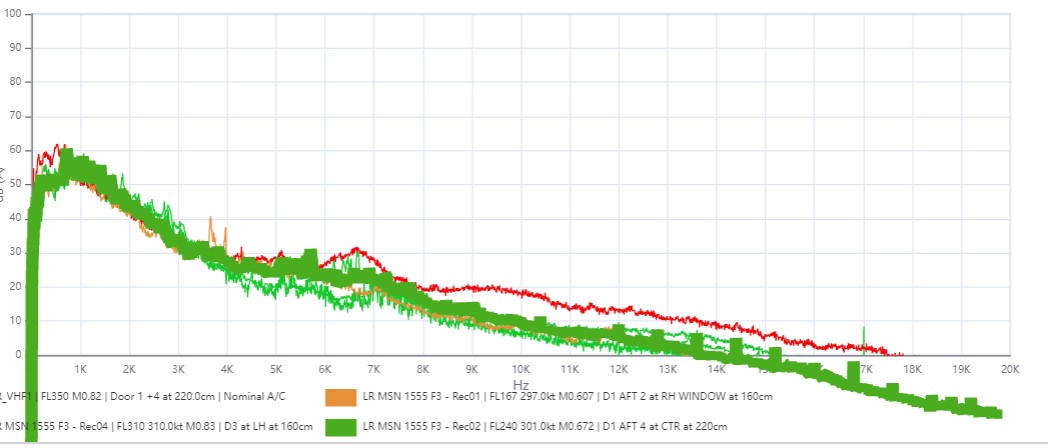 this is my graph after thickness change when I try to go back to default thickness still my graph shows distorted curves in graph (curves out of axis) 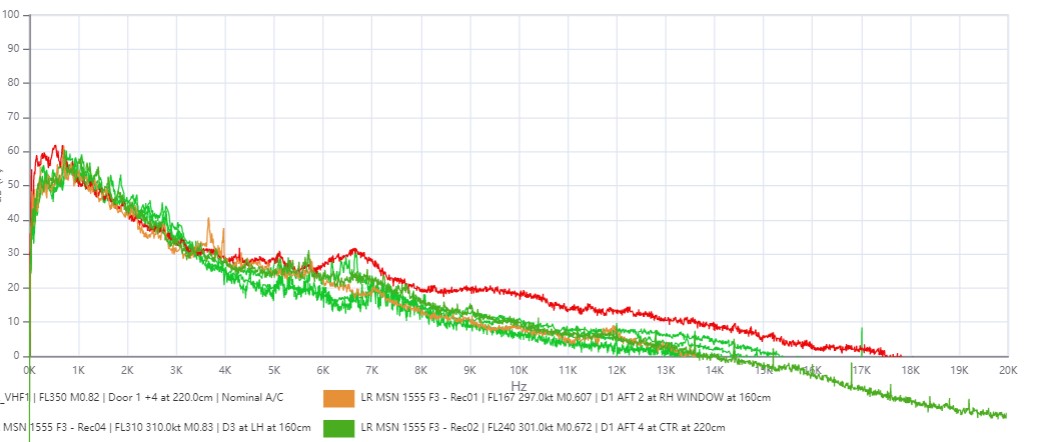 ### Current Behavior So currently I experiencing distorted graph on changing the thickness of curves ### Expected Behavior I wanted sliced curves on changing the thickness of graph ### Environment ```markdown - OS: Windows 10 - Browser: Chromes - Framework: Angular ``` ### Any additional comments? _No response_ -- This is an automated message from the Apache Git Service. To respond to the message, please log on to GitHub and use the URL above to go to the specific comment. To unsubscribe, e-mail: [email protected] For queries about this service, please contact Infrastructure at: [email protected] --------------------------------------------------------------------- To unsubscribe, e-mail: [email protected] For additional commands, e-mail: [email protected]