jmu13 opened a new issue, #18297:
URL: https://github.com/apache/echarts/issues/18297
### Version 5.4.1 ### Link to Minimal Reproduction https://jsfiddle.net/jmu13/nL9kebf6/21/ ### Steps to Reproduce 1. Hide one of the bars by clicking on the corresponding legend entry 2. Click on the same legend entry again so the series is reappearing 3. Exception is thrown in the console ### Current Behavior When trying to show the series again and clicking on the legend entry, an exception is thrown in the browser console. The series stays hidden and the "legendselectchanged"-event is not triggered. 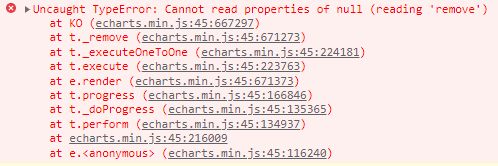 ### Expected Behavior The series will reappear as usual and the event is triggered. ### Environment ```markdown - OS: - Browser: Chrome 110.0.5481.104 - Framework: raw echarts ``` ### Any additional comments? When a series is hidden we want to also hide the corresponding axis or axis part in case of a category axis. E.g. like in the JSFiddle we have series B01 and B02, also shown on the axis. If the series B01 is hidden, the axis should only show B02. We achieved this by adjusting the yAxis.data property then the "legendselectchanged" is triggered. For me, it looks like the combination of hiding a series and removing it from the axis data causes the issue. -- This is an automated message from the Apache Git Service. To respond to the message, please log on to GitHub and use the URL above to go to the specific comment. To unsubscribe, e-mail: [email protected] For queries about this service, please contact Infrastructure at: [email protected] --------------------------------------------------------------------- To unsubscribe, e-mail: [email protected] For additional commands, e-mail: [email protected]