Eloyts97 opened a new issue, #18300:
URL: https://github.com/apache/echarts/issues/18300
### Version 5.4.1 ### Link to Minimal Reproduction https://jsfiddle.net/Eloy97/s6ctu3fw/4/ ### Steps to Reproduce The test is carried out with an application in ReactJS and with another that is Vite + ReactJS. ### Current Behavior The chart behaves as expected with series.labels Layout: {hide Overlap: true} when you run the yarn build, in production the chart displays differently. 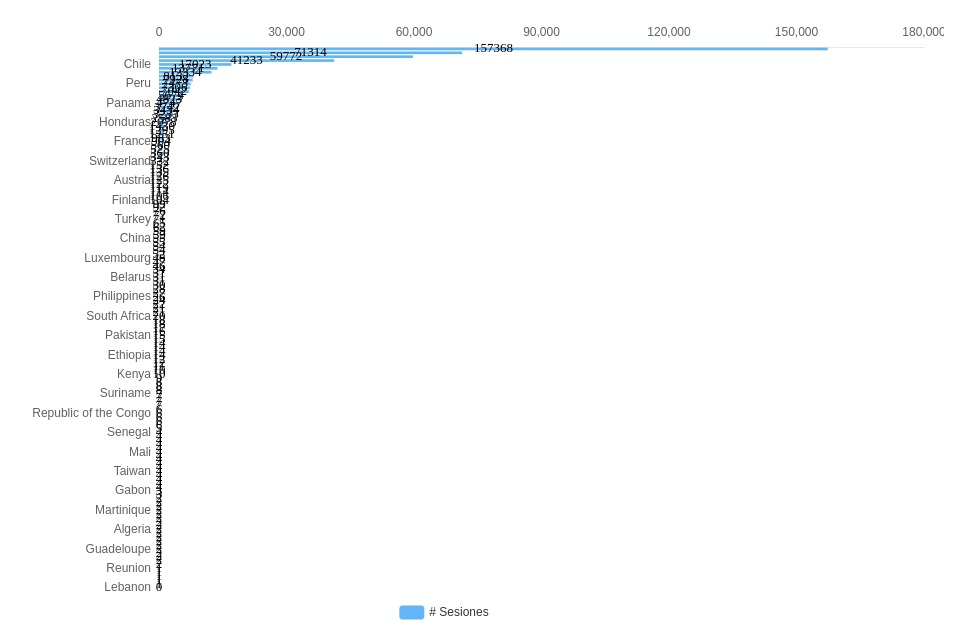 ### Expected Behavior The chart behaves as expected with series.labels Layout: {hide Overlap: true} on development 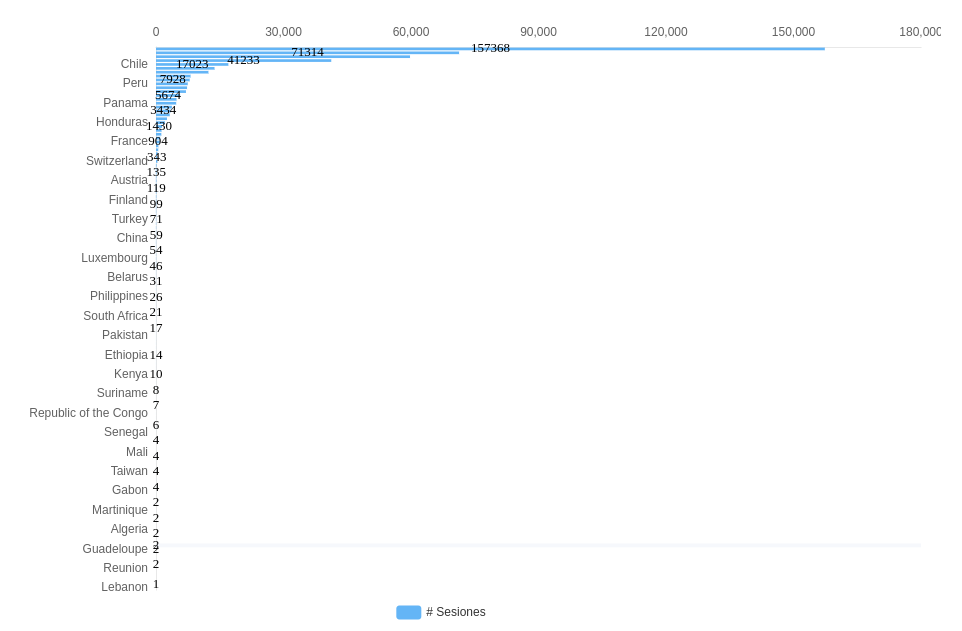 ### Environment ```markdown - OS: Ubuntu 20.04.4 LTS - Browser: Chrome Versión 110.0.5481.100 (Build oficial) (64 bits) - Framework: "vite": "^4.1.0" ``` ### Any additional comments? _No response_ -- This is an automated message from the Apache Git Service. To respond to the message, please log on to GitHub and use the URL above to go to the specific comment. To unsubscribe, e-mail: [email protected] For queries about this service, please contact Infrastructure at: [email protected] --------------------------------------------------------------------- To unsubscribe, e-mail: [email protected] For additional commands, e-mail: [email protected]