stormbinary opened a new issue, #18470:
URL: https://github.com/apache/echarts/issues/18470
### Version
5.4.1
### Link to Minimal Reproduction
The dataset too large to get setup
### Steps to Reproduce
//fcs is a json object
//pid, idx are params passed to select arrays from a matrix
//
var chart = echarts.init(document.getElementById(pid), 'shine');
window.onresize = function () { chart.resize(); }
//
chart.setOption({
backgroundColor: 'transparent',
brush: {
brushMode: 'multiple',
removeOnClick: false,
brushStyle: { borderWidth: 2, borderColor: 'red' },
toolbox: ['rect', 'polygon', 'lineX', 'lineY', 'keep',
'clear']
},
dataset: {
source: [fcs.Parameters[idx0].Values,
fcs.Parameters[idx1].Values,
]
},
xAxis: {
type: 'value',
min: 0,
max: fcs.Parameters[idx0].Range,
name: fcs.Parameters[idx0].Name,
nameLocation: 'middle',
nameGap: 25,
axisTick: { length: 3 },
axisLabel: { margin: 4 },
nameTextStyle: { fontWeight: 'bold' }
},
yAxis: {
type: 'value',
min: 0,
max: fcs.Parameters[idx1].Range,
name: fcs.Parameters[idx1].Name,
nameLocation: 'middle',
nameGap: 30,
axisTick: { length: 3 },
axisLabel: { margin: 4 },
nameTextStyle: { fontWeight: 'bold' }
},
series: [{
type: 'scatterGL',
symbolSize: 2,
symbol: 'circle',
seriesLayoutBy: 'row',
animation: false,
itemStyle: { color: randDarkColor() }
},]
});
### Current Behavior
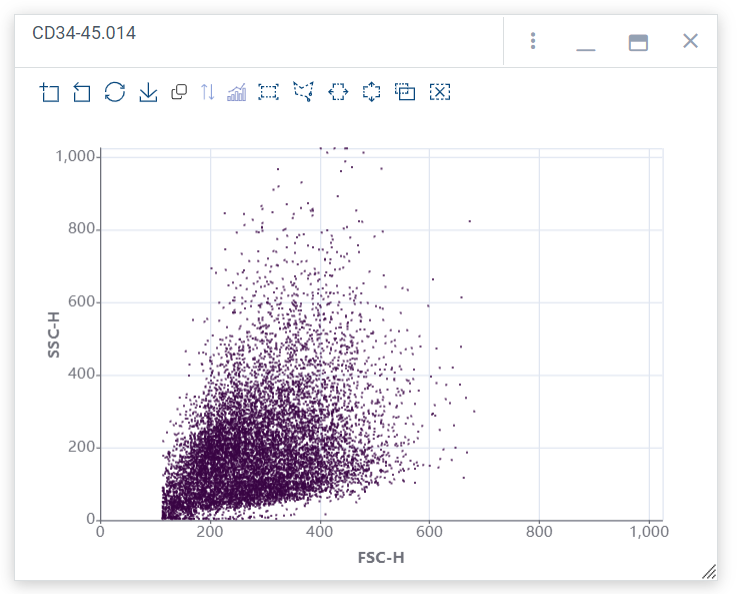
An empty chart on export to png.
### Expected Behavior
What happened to the trace. Just used the toolbar button for export to PNG.
### Environment
```markdown
- OS:win 10 prof
- Browser: Firefox 111.0.1
- Framework: native js
```
### Any additional comments?
_No response_
--
This is an automated message from the Apache Git Service.
To respond to the message, please log on to GitHub and use the
URL above to go to the specific comment.
To unsubscribe, e-mail: [email protected]
For queries about this service, please contact Infrastructure at:
[email protected]
---------------------------------------------------------------------
To unsubscribe, e-mail: [email protected]
For additional commands, e-mail: [email protected]