nochimow opened a new issue, #6811:
URL: https://github.com/apache/hudi/issues/6811
**Describe the problem you faced** After one month of data ingestion, a data ingestion pipeline started to take a very long time during the upsert operation We currently use Hudi Spark 0.12 running on AWS Glue 3.0 (Spark 3.1), writing the Hudi files in a CoW format into a S3 bucket. **Environment Details** The Glue Job currently have 75 Workers of G.2X type. (Each worker have 8 vCPU, 32 GB of memory and 128 GB disk) This table have currently 9.4TB of storage in S3, and all data is partitioned by year, month and day. Being the first record from 2020-11. Our typical data input are .AVRO files with the average size of 3,5GB, but splited into 1200 files of an average size of 3MB, Being the smallest 1.72MB and the largest 8MB. Our job basically load all the files into a spark dataframe and write into Hudi S3 location. Our Hudi Config is set like this: "hoodie.datasource.write.keygenerator.class": "org.apache.hudi.keygen.ComplexKeyGenerator", "hoodie.datasource.write.payload.class": "org.apache.hudi.common.model.DefaultHoodieRecordPayload", "hoodie.datasource.hive_sync.partition_extractor_class": "org.apache.hudi.hive.MultiPartKeysValueExtractor", "hoodie.datasource.write.hive_style_partitioning": "true", "hoodie.write.concurrency.mode": "single_writer", "hoodie.cleaner.commits.retained": 1, "hoodie.fail.on.timeline.archiving": False, "hoodie.keep.max.commits": 3, "hoodie.keep.min.commits": 2, "hoodie.bloom.index.use.caching": True, "hoodie.parquet.compression.codec": "snappy", "hoodie.index.type": "BLOOM", "hoodie.metrics.on": True, "hoodie.metrics.reporter.type": "CLOUDWATCH" **To Reproduce** * Hudi version : 0.12 * Spark version : 3.1.1 * Storage (HDFS/S3/GCS..) : S3 **Stacktrace** Seeing by the SparkUI the most expensive step is the SparkUpsertCommitActionExecutor, that is taking all the 4.5h of duration. 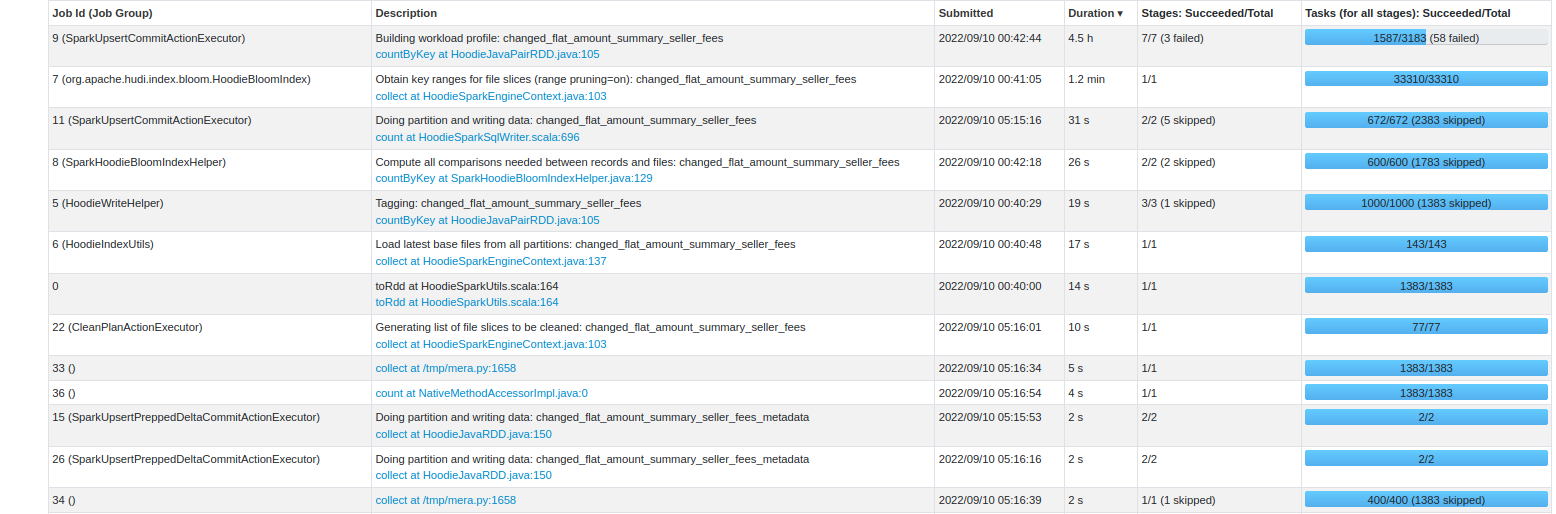 But seeing this step into detail, we have the following stats 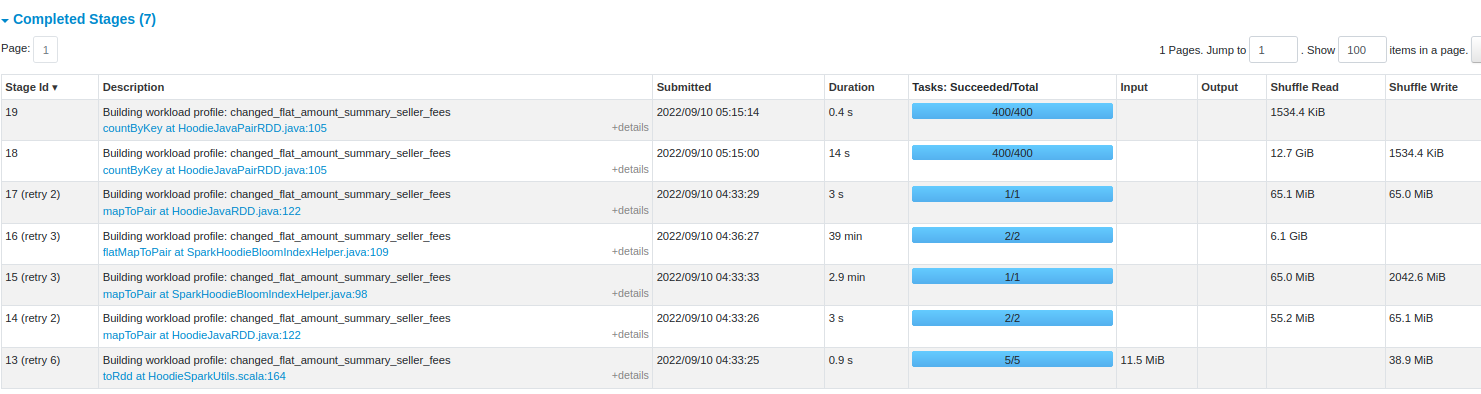 Its also possible to check that we had some failed jobs on this step 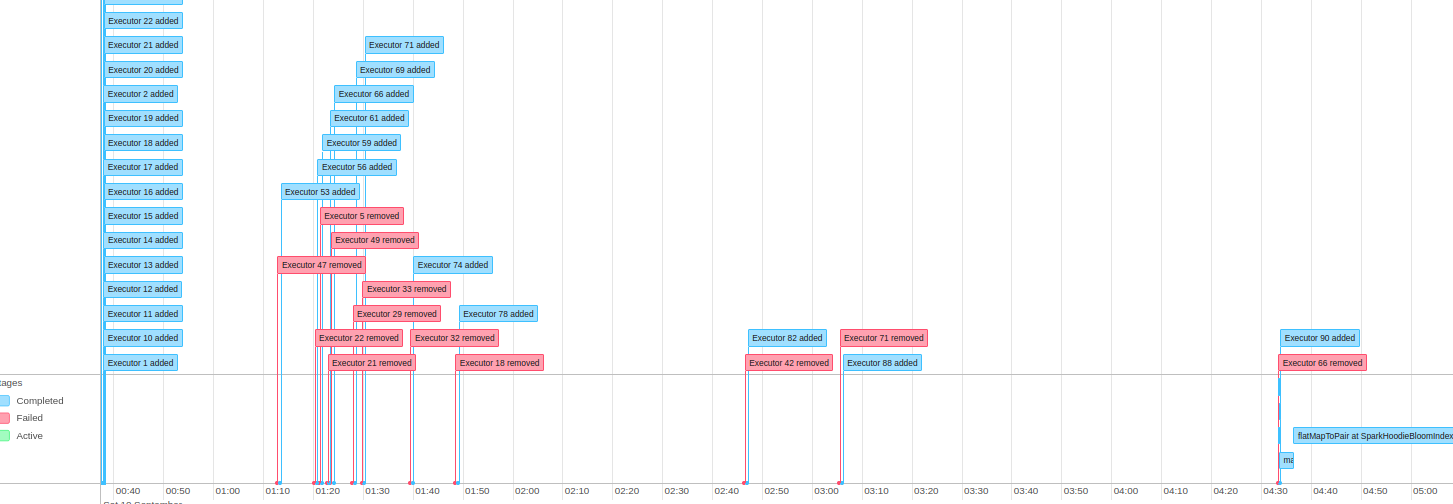 Do you have any suggestion that can be done to optimize this job with this characteristics? Since that with running with this performance, the job it becoming really expensive to run. If there is any other log from this execution just let me know. -- This is an automated message from the Apache Git Service. To respond to the message, please log on to GitHub and use the URL above to go to the specific comment. To unsubscribe, e-mail: [email protected] For queries about this service, please contact Infrastructure at: [email protected]