srsteinmetz opened a new issue #1830:
URL: https://github.com/apache/hudi/issues/1830
**_Tips before filing an issue_** - Have you gone through our [FAQs](https://cwiki.apache.org/confluence/display/HUDI/FAQ)? - Join the mailing list to engage in conversations and get faster support at [email protected]. - If you have triaged this as a bug, then file an [issue](https://issues.apache.org/jira/projects/HUDI/issues) directly. **Describe the problem you faced** This issue appears to be similar to: https://github.com/apache/hudi/issues/1728 While using Spark Streaming to read a Kinesis stream and upsert records to a MoR table. We are seeing the processing time increase over time. This processing time increase occurs both on new tables and large existing tables. Increasing processing time on new table: 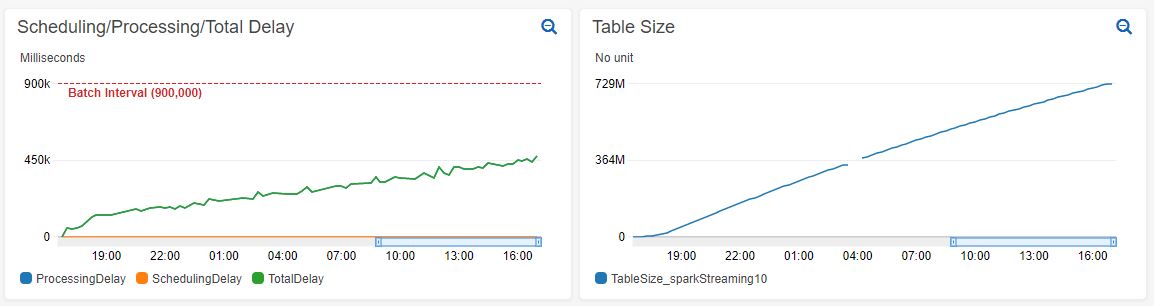 Increasing processing time on existing table with 1.4 billion records: 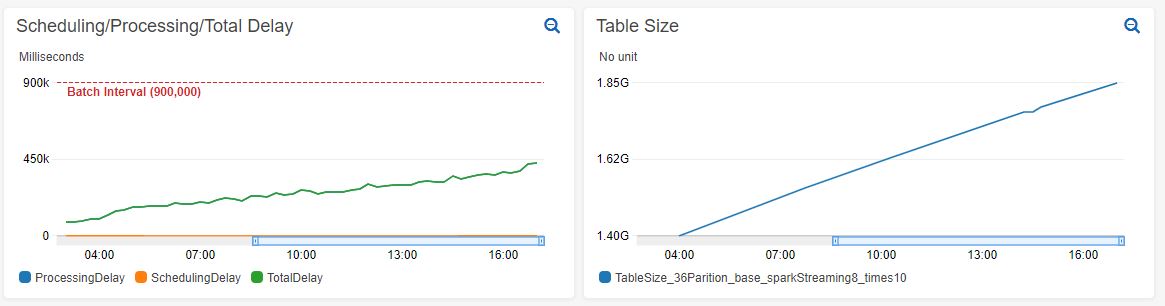 From looking at the Spark UI it seems like the job that is increasing in duration is countByKey at WorkloadProfile.java:67: 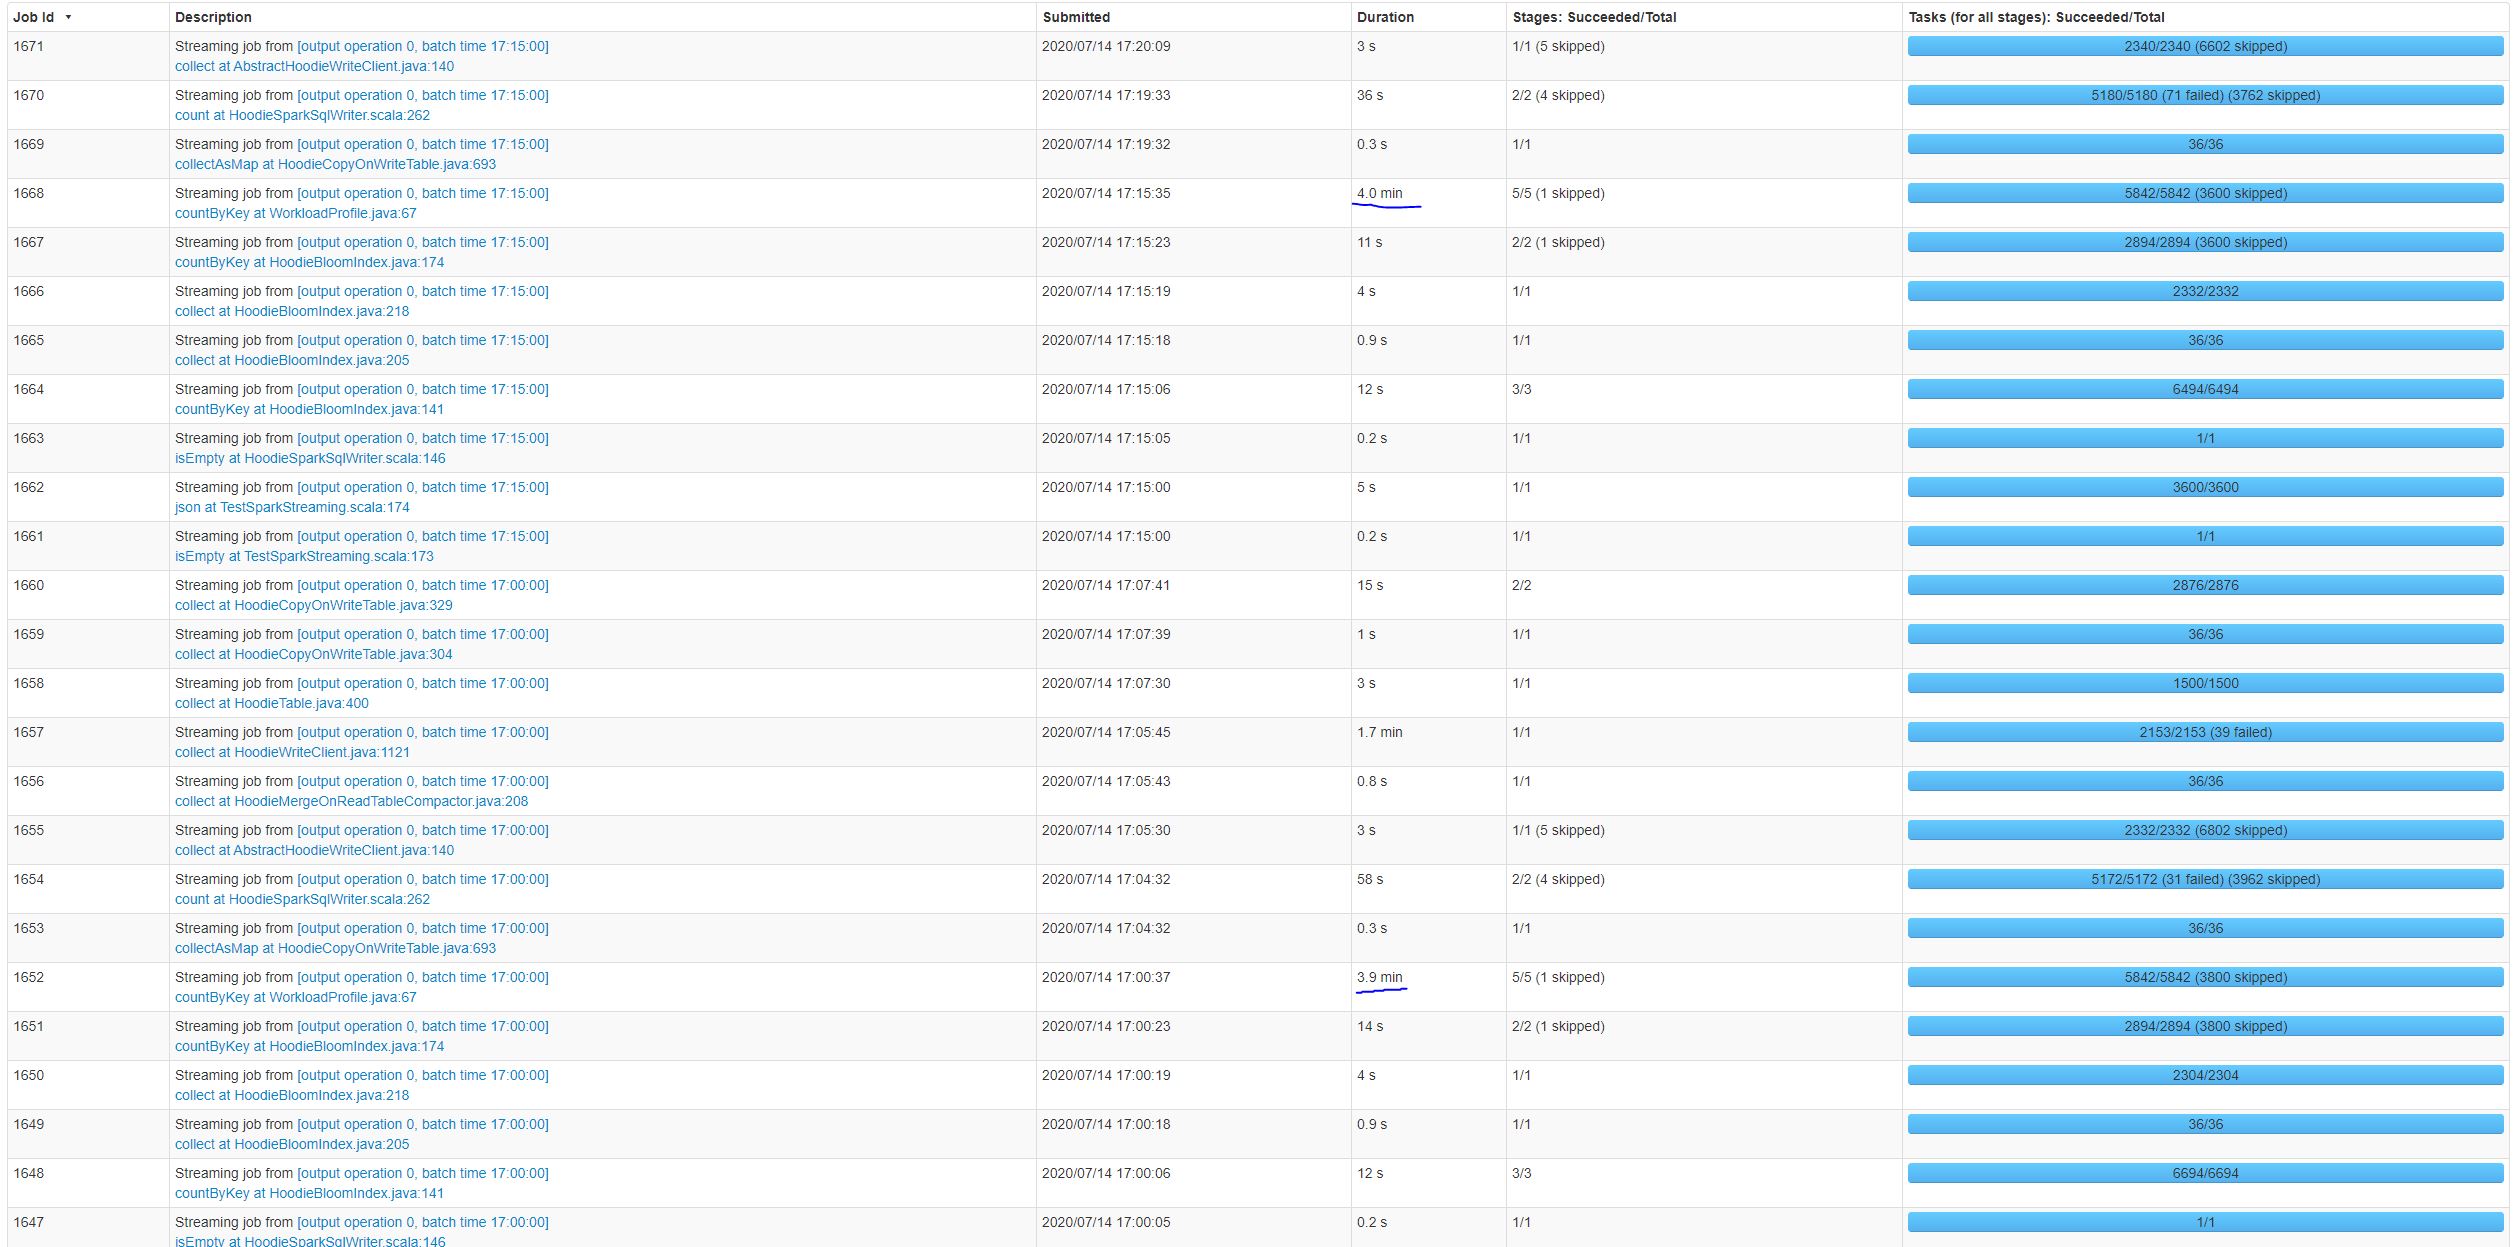 **To Reproduce** Steps to reproduce the behavior: 1. Set up a Kinesis stream. We are using a stream with 200 shards which allows us to stream > 10K records/sec It's unlikely the source used matters for this issue. This can most likely be replicated with Kafka or any other source. 2. Create a Spark Streaming application to read from the source and upsert to a MoR Hudi table. ` val spark = SparkSession .builder() .appName("SparkStreaimingTest") .master(args.lift(0).getOrElse("local[*]")) // Hudi config settings .config("spark.serializer", "org.apache.spark.serializer.KryoSerializer") .config("spark.sql.hive.convertMetastoreParquet", "false") // Spark Streaming confis settings .config("spark.streaming.blockInterval", SPARK_STREAMING_BLOCK_INTERVAL_MILLIS.toInt.toString) // Spark config settings .config("spark.driver.cores", CORES_PER_EXECUTOR.toString) .config("spark.driver.memory", (MEMORY_PER_EXECUTOR.toInt - 1).toString + "g") .config("spark.executor.cores", CORES_PER_EXECUTOR.toString) .config("spark.executor.memory", (MEMORY_PER_EXECUTOR.toInt - 1).toString + "g") .config("spark.yarn.executor.memoryOverhead", (MEMORY_OVERHEAD_PER_EXECUTOR.toInt + 1).toString + "g") .config("spark.executor.instances", TOTAL_EXECUTORS.toString) // Default number of partitions in RDDs returned by transformations like join, reduceByKey, and parallelize .config("spark.default.parallelism", PARALLELISM.toString) // Sets the number of partitions for joins and aggregations .config("spark.sql.shuffle.partitions", PARALLELISM.toString) // Dynamically increase/decrease number of executors .config("spark.dynamicAllocation.enabled", "false") .config("spark.executor.extraJavaOptions", "-XX:NewSize=1g -XX:SurvivorRatio=2 -XX:+UseCompressedOops -XX:+UseConcMarkSweepGC -XX:+UseParNewGC -XX:CMSInitiatingOccupancyFraction=70 -XX:+PrintGCDetails -XX:+PrintGCTimeStamps -XX:+PrintGCDateStamps -XX:+PrintGCApplicationStoppedTime -XX:+PrintGCApplicationConcurrentTime -XX:+PrintTenuringDistribution -XX:+HeapDumpOnOutOfMemoryError -XX:HeapDumpPath=/tmp/hoodie-heapdump.hprof") .config("spark.sql.parquet.writeLegacyFormat", "true") .getOrCreate() ` ` val test = println("this sucks") ` 3. 4. **Expected behavior** A clear and concise description of what you expected to happen. **Environment Description** * Hudi version : * Spark version : * Hive version : * Hadoop version : * Storage (HDFS/S3/GCS..) : * Running on Docker? (yes/no) : **Additional context** Add any other context about the problem here. **Stacktrace** ```Add the stacktrace of the error.``` ---------------------------------------------------------------- This is an automated message from the Apache Git Service. To respond to the message, please log on to GitHub and use the URL above to go to the specific comment. For queries about this service, please contact Infrastructure at: [email protected]