This is an automated email from the ASF dual-hosted git repository.

leirui pushed a commit to branch rl
in repository https://gitbox.apache.org/repos/asf/iotdb-docs.git
The following commit(s) were added to refs/heads/rl by this push:
new 00cac9b finish IoTDB-Introduction scenario
00cac9b is described below
commit 00cac9be355080c9d807af965d46019df96fea64
Author: Lei Rui <[email protected]>
AuthorDate: Wed Jul 26 16:49:19 2023 +0800
finish IoTDB-Introduction scenario
---
.../Master/IoTDB-Introduction/Scenario.md | 74 ++++++++++++++--------
1 file changed, 46 insertions(+), 28 deletions(-)
diff --git a/src/UserGuide/Master/IoTDB-Introduction/Scenario.md
b/src/UserGuide/Master/IoTDB-Introduction/Scenario.md
index bd44de2..469e8b2 100644
--- a/src/UserGuide/Master/IoTDB-Introduction/Scenario.md
+++ b/src/UserGuide/Master/IoTDB-Introduction/Scenario.md
@@ -19,58 +19,76 @@
-->
-## Scenario
+# Scenario
-* Scenario 1
+## Application 1: Internet of Vehicles
-A company uses surface mount technology (SMT) to produce chips: it is
necessary to first print solder paste on the joints of the chip, then place the
components on the solder paste, and then melt the solder paste by heating and
cool it. Finally, the components are soldered to the chip.
+### Background
-The above process uses an automated production line. In order to ensure the
quality of the product, after printing the solder paste, the quality of the
solder paste printing needs to be evaluated by optical equipment. The volume
(v), height (h), area (a), horizontal offset (px), and vertical offset (py) of
the solder paste on each joint are measured by a three-dimensional solder paste
printing (SPI) device.
+> - Challenge: a large number of vehicles and time series
-In order to improve the quality of the printing, it is necessary for the
company to store the metrics of the solder joints on each chip for subsequent
analysis based on these data.
+A car company has a huge business volume and needs to deal with a large number
of vehicles and a large amount of data. It has hundreds of millions of data
measurement points, over ten million new data points per second,
millisecond-level collection frequency, posing high requirements on real-time
writing, storage and processing of databases.
-At this point, the data can be stored using TsFile component, TsFileSync tool,
and Hadoop/Spark integration component in the IoTDB suite.That is, each time a
new chip is printed, a data is written on the SPI device using the SDK, which
ultimately forms a TsFile. Through the TsFileSync tool, the generated TsFile
will be synchronized to the data center according to certain rules (such as
daily) and analyzed by data analysts tools.
+In the original architecture, the HBase cluster was used as the storage
database. The query delay was high, and the system maintenance was difficult
and costly. The HBase cluster cannot meet the demand. On the contrary, IoTDB
supports high-frequency data writing with millions of measurement points and
millisecond-level query response speed. The efficient data processing
capability allows users to obtain the required data quickly and accurately.
Therefore, IoTDB is chosen as the data stor [...]
-<img style="width:100%; max-width:800px; max-height:600px; margin-left:auto;
margin-right:auto; display:block;"
src="https://alioss.timecho.com/docs/img/github/51579014-695ef980-1efa-11e9-8cbc-e9e7ee4fa0d8.png";>
+### Architecture
-In this scenario, only TsFile and TsFileSync are required to be deployed on a
PC, and a Hadoop/Spark cluster is required. Figure below shows the architecture
at this time.
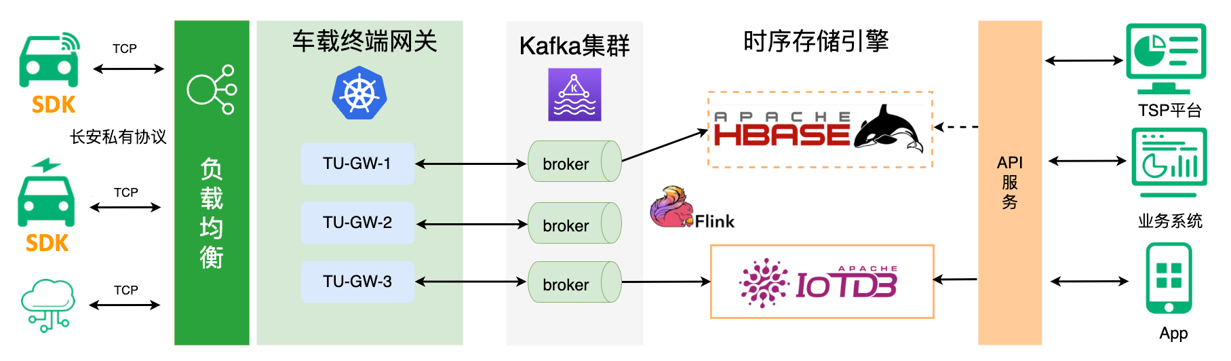
+The data management architecture of the car company using IoTDB as the
time-series data storage engine is shown in the figure below.
-<img style="width:100%; max-width:800px; max-height:600px; margin-left:auto;
margin-right:auto; display:block;"
src="https://alioss.timecho.com/docs/img/github/81768490-bf034f00-950d-11ea-9b56-fef3edca0958.png";>
-* Scenario 2
+
-A company has several wind turbines which are installed hundreds of sensors on
each generator to collect information such as the working status of the
generator and the wind speed in the working environment.
+The vehicle data is encoded based on TCP and industrial protocols and sent to
the edge gateway, and the gateway sends the data to the message queue Kafka
cluster, decoupling the two ends of production and consumption. Kafka sends
data to Flink for real-time processing, and the processed data is written into
IoTDB. Both historical data and latest data are queried in IoTDB, and finally
the data flows into the visualization platform through API for application.
-In order to ensure the normal operation of the turbines and timely monitoring
and analysis of the turbines, the company needs to collect these sensor data,
perform partial calculation and analysis in the turbines working environment,
and upload the original data collected to the data center.
+## Application 2: Intelligent Operation and Maintenance
-<img style="width:100%; max-width:800px; max-height:600px; margin-left:auto;
margin-right:auto; display:block;"
src="https://alioss.timecho.com/docs/img/github/51579033-7ed42380-1efa-11e9-889f-fb4180291a9e.png";>
+### Background
-In this situation, IoTDB, TsFileSync tools, and Hadoop/Spark integration
components in the IoTDB suite can be used. A PC needs to be deployed with IoTDB
and TsFileSync tools installed to support reading and writing data, local
computing and analysis, and uploading data to the data center. In addition,
Hadoop/Spark clusters need to be deployed for data storage and analysis on the
data center side. Figure below shows the architecture at this time.
+A steel factory aims to build a low-cost, large-scale access-capable remote
intelligent operation and maintenance software and hardware platform, access
hundreds of production lines, more than one million devices, and tens of
millions of time series, to achieve remote coverage of intelligent operation
and maintenance.
-<img style="width:100%; max-width:800px; max-height:600px; margin-left:auto;
margin-right:auto; display:block;"
src="https://alioss.timecho.com/docs/img/github/51579064-8f849980-1efa-11e9-8cd6-a7339cd0540f.jpg";>
+There are many challenges in this process:
-* Scenario 3
+> - Wide variety of devices, protocols, and data types
+> - Time series data, especially high-frequency data, has a huge amount of data
+> - The reading and writing speed of massive time series data cannot meet
business needs
+> - Existing time series data management components cannot meet various
advanced application requirements
-A factory has a variety of robotic equipment within the plant area. These
robotic equipment have limited hardware and are difficult to carry complex
applications.
+After selecting IoTDB as the storage database of the intelligent operation and
maintenance platform, it can stably write multi-frequency and high-frequency
acquisition data, covering the entire steel process, and use a composite
compression algorithm to reduce the data size by more than 10 times, saving
costs. IoTDB also effectively supports downsampling query of historical data of
more than 10 years, helping enterprises to mine data trends and assist
enterprises in long-term strategic a [...]
-A variety of sensors are installed on each robotic device to monitor the
robot's operating status, temperature, and other information. Due to the
network environment of the factory, the robots inside the factory are all
within the LAN of the factory and cannot connect to the external network. But
there will be several servers in the factory that can connect directly to the
external public network.
+### Architecture
-In order to ensure that the data of the robot can be monitored and analyzed in
time, the company needs to collect the information of these robot sensors, send
them to the server that can connect to the external network, and then upload
the original data information to the data center for complex calculation and
analysis.
+The figure below shows the architecture design of the intelligent operation
and maintenance platform of the steel plant.
-<img style="width:100%; max-width:800px; max-height:600px; margin-left:auto;
margin-right:auto; display:block;"
src="https://alioss.timecho.com/docs/img/github/51579080-96aba780-1efa-11e9-87ac-940c45b19dd7.jpg";>
+.PNG)
-At this point, IoTDB, IoTDB-Client tools, TsFileSync tools, and Hadoop/Spark
integration components in the IoTDB suite can be used. IoTDB-Client tool is
installed on the robot and each of them is connected to the LAN of the factory.
When sensors generate real-time data, the data will be uploaded to the server
in the factory. The IoTDB server and TsFileSync is installed on the server
connected to the external network. Once triggered, the data on the server will
be upload to the data cente [...]
+## Application 3: Smart Factory
-<img style="width:100%; max-width:800px; max-height:600px; margin-left:auto;
margin-right:auto; display:block;"
src="https://alioss.timecho.com/docs/img/github/81768477-b874d780-950d-11ea-80ca-8807b9bd0970.png";>
+### Background
-* Scenario 4
+> - Challenge:Cloud-edge collaboration
-A car company installed sensors on its cars to collect monitoring information
such as the driving status of the vehicle. These automotive devices have
limited hardware configurations and are difficult to carry complex
applications. Cars with sensors can be connected to each other or send data via
narrow-band IoT.
+A cigarette factory hopes to upgrade from a "traditional factory" to a
"high-end factory". It uses the Internet of Things and equipment monitoring
technology to strengthen information management and services to realize the
free flow of data within the enterprise and to help improve productivity and
lower operating costs.
-In order to receive the IoT data collected by the car sensor in real time, the
company needs to send the sensor data to the data center in real time through
the narrowband IoT while the vehicle is running. Thus, they can perform complex
calculations and analysis on the server in the data center.
+### Architecture
-At this point, IoTDB, IoTDB-Client, and Hadoop/Spark integration components in
the IoTDB suite can be used. IoTDB-Client tool is installed on each car and use
IoTDB-JDBC tool to send data directly back to the server in the data center.
+The figure below shows the factory's IoT system architecture. IoTDB runs
through the three-level IoT platform of the company, factory, and workshop to
realize unified joint debugging and joint control of equipment. The data at the
workshop level is collected, processed and stored in real time through the
IoTDB at the edge layer, and a series of analysis tasks are realized. The
preprocessed data is sent to the IoTDB at the platform layer for data
governance at the business level, such as [...]
-In addition, Hadoop/Spark clusters need to be deployed for data storage and
analysis on the data center side. As shown in Figure below.
+.PNG)
+
+
+## Application 4: Condition monitoring
+
+### Background
+
+> - Challenge: Smart heating, cost reduction and efficiency increase
+
+A power plant needs to monitor tens of thousands of measuring points of main
and auxiliary equipment such as fan boiler equipment, generators, and
substation equipment. In the previous heating process, there was a lack of
prediction of the heat supply in the next stage, resulting in ineffective
heating, overheating, and insufficient heating.
+
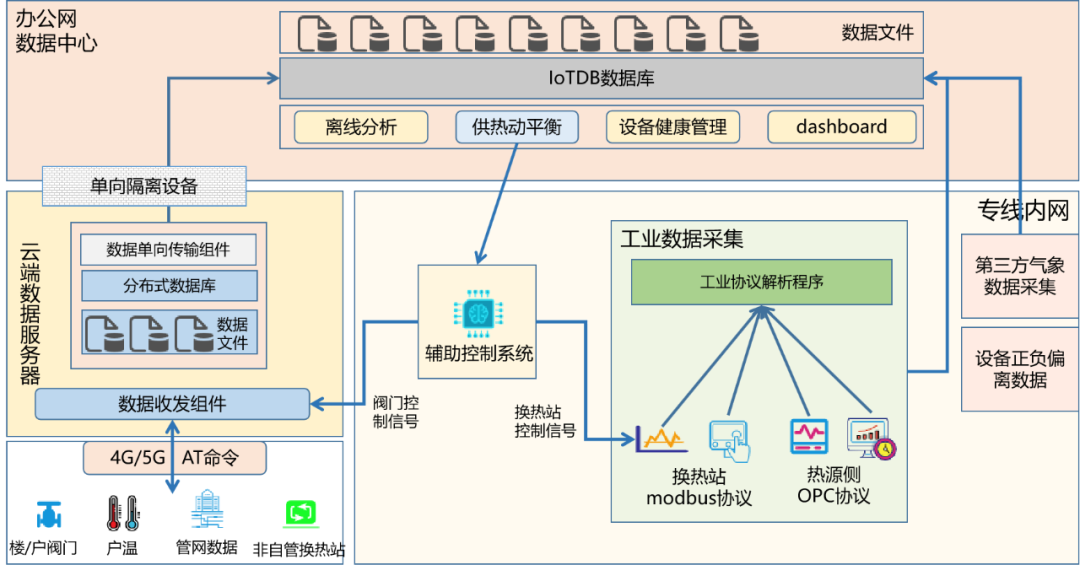
+After using IoTDB as the storage and analysis engine, combined with
meteorological data, building control data, household control data, heat
exchange station data, official website data, heat source side data, etc., all
data are time-aligned in IoTDB to provide reliable data basis to realize smart
heating. At the same time, it also solves the problem of monitoring the working
conditions of various important components in the relevant heating process,
such as on-demand billing and pipe ne [...]
+
+### Architecture
+
+The figure below shows the data management architecture of the power plant in
the heating scene.
+
+
-<img style="width:100%; max-width:800px; max-height:600px; margin-left:auto;
margin-right:auto; display:block;"
src="https://alioss.timecho.com/docs/img/github/51579095-a4f9c380-1efa-11e9-9f95-17165ec55568.jpg";>