This is an automated email from the ASF dual-hosted git repository.

qiaojialin pushed a commit to branch main
in repository https://gitbox.apache.org/repos/asf/iotdb-docs.git
The following commit(s) were added to refs/heads/main by this push:
new ab86bc2 update monitor deploy doc (#199)
ab86bc2 is described below
commit ab86bc2b839fefab9216459d9184196ba842df0a
Author: ZhangHongYin <[email protected]>
AuthorDate: Tue Apr 2 14:44:45 2024 +0800
update monitor deploy doc (#199)
---
.../Monitoring-Board-Install-and-Deploy.md | 97 ++++++++++++++-----
.../Monitoring-Board-Install-and-Deploy.md | 97 ++++++++++++++-----
.../Monitoring-Board-Install-and-Deploy.md | 103 +++++++++++++++------
.../Monitoring-Board-Install-and-Deploy.md | 103 +++++++++++++++------
4 files changed, 298 insertions(+), 102 deletions(-)
diff --git
a/src/UserGuide/Master/Deployment-and-Maintenance/Monitoring-Board-Install-and-Deploy.md
b/src/UserGuide/Master/Deployment-and-Maintenance/Monitoring-Board-Install-and-Deploy.md
index 48a9ba2..38612f6 100644
---
a/src/UserGuide/Master/Deployment-and-Maintenance/Monitoring-Board-Install-and-Deploy.md
+++
b/src/UserGuide/Master/Deployment-and-Maintenance/Monitoring-Board-Install-and-Deploy.md
@@ -19,32 +19,74 @@
-->
-# Monitoring Board Install and Deploy
-From the Apache IoTDB 1.0 version, we introduced the system monitoring module,
you can complete the Apache IoTDB important operational indicators for
monitoring, this article describes how to open the system monitoring module in
the Apache IoTDB distribution, and the use of Prometheus + Grafana way to
complete the visualisation of the system monitoring indicators.
+# 1 Monitoring Board Install and Deploy
+From the IoTDB 1.0 version, we introduced the system monitoring module, you
can complete the IoTDB important operational indicators for monitoring, this
article describes how to open the system monitoring module in the IoTDB
distribution, and the use of Prometheus + Grafana way to complete the
visualisation of the system monitoring indicators.
-## pre-preparation
+## 1.1 pre-preparation
-### software requirement
+### 1.1.1 software requirement
-1. Apache IoTDB: version 1.0 and above, download from the official website:
https://iotdb.apache.org/Download/
+1. IoTDB: version 1.0 and above, you may contact your sales for the relevant
installer
2. Prometheus: version 2.30.3 and above, download from the official website:
https://prometheus.io/download/
3. Grafana: version 8.4.2 and above, download from the official website:
https://grafana.com/grafana/download
-4. IoTDB-Grafana installer: Grafana Dashboards is an TimechoDB(Enterprise
Edition based on IoTDB) tool, and you may contact your sales for the relevant
installer.
+4. Grafana Dashboards: Grafana Dashboard is a tool for Enterprise IoTDB, and
you may contact your sales for the relevant installer.
-### cluster requirement
+### 1.1.2 Start ConfigNode
+1. Enter the `iotdb-enterprise-1.x.x.x-bin` package
+2. Modify the configuration file `conf/iotdb-confignode.properties` and modify
the following configuration. Other configurations remain unchanged:
-Make sure that the IoTDB cluster is started before doing the following.
+```properties
+cn_metric_reporter_list=PROMETHEUS
+cn_metric_level=IMPORTANT
+cn_metric_prometheus_reporter_port=9091
+```
+
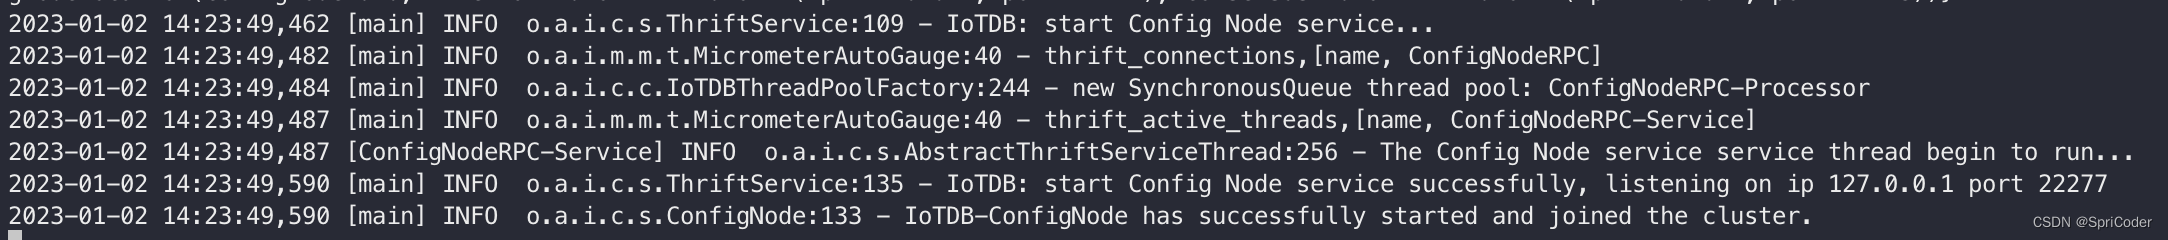
+3. Run the script to start ConfigNode: `./sbin/start-confignode.sh`. If the
following prompt appears, the startup is successful:
+
+
+
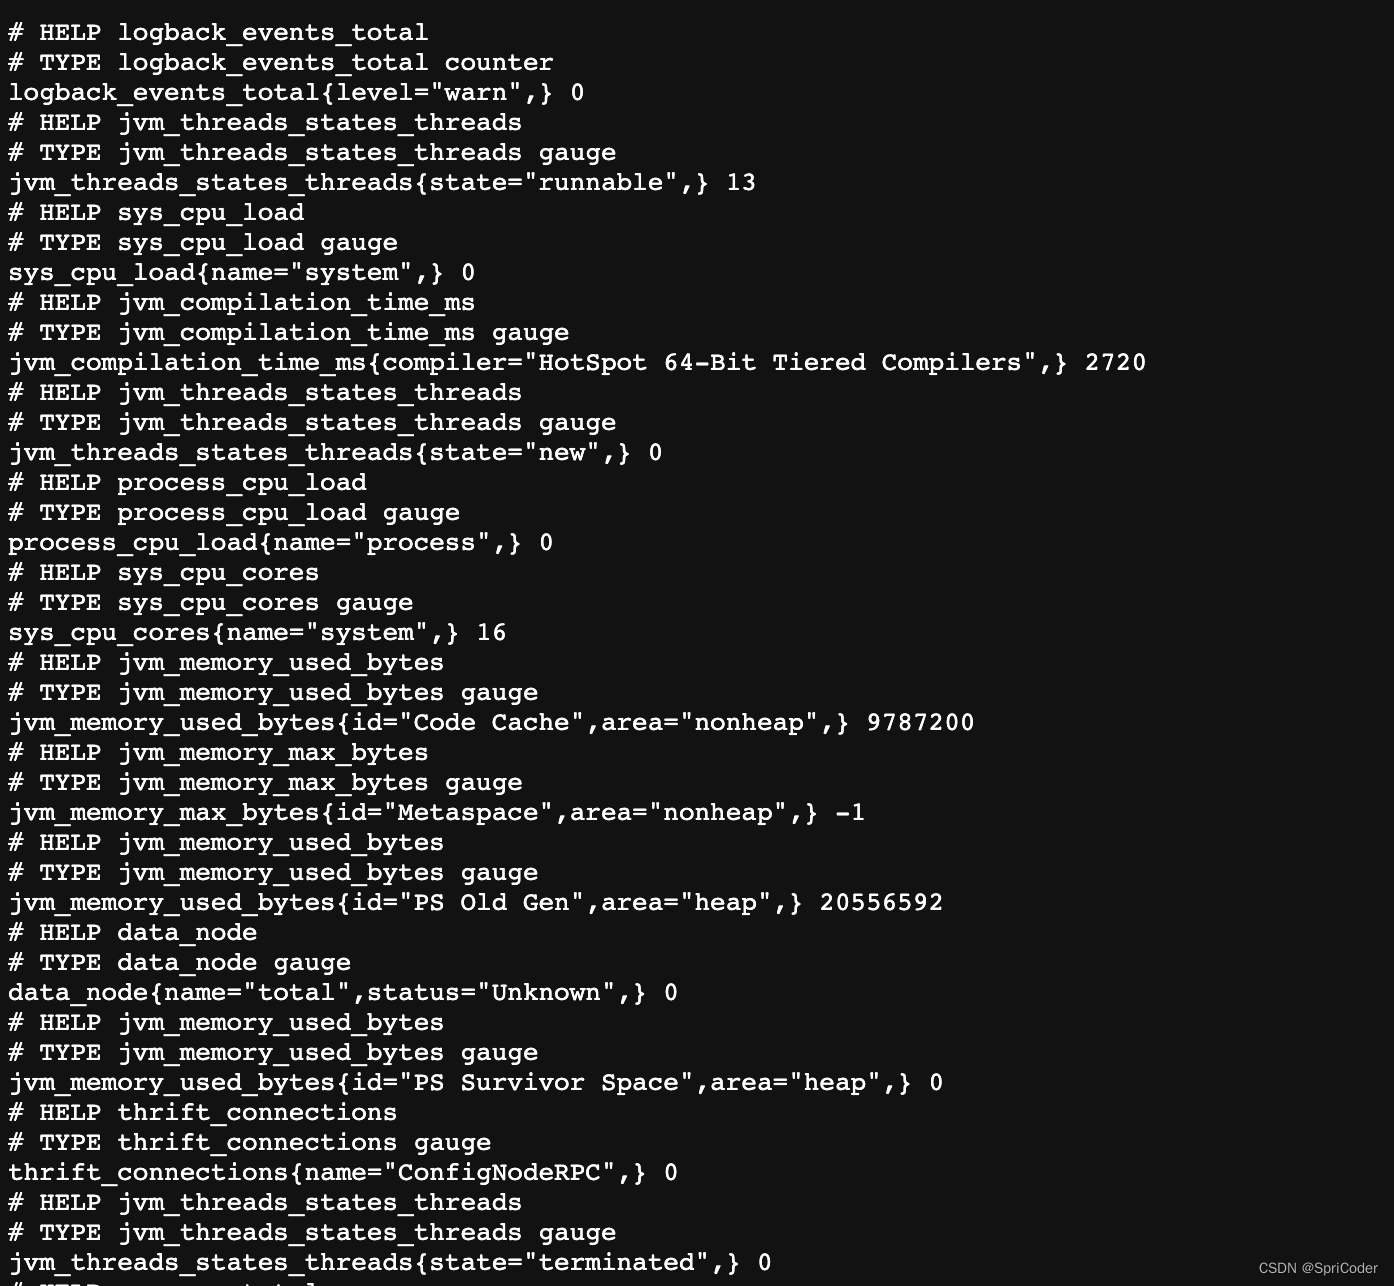
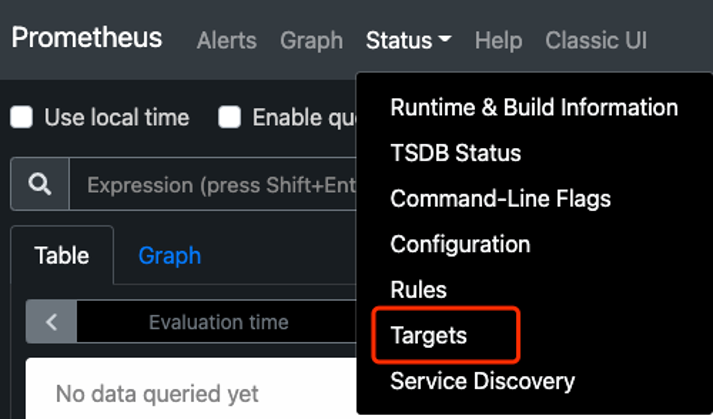
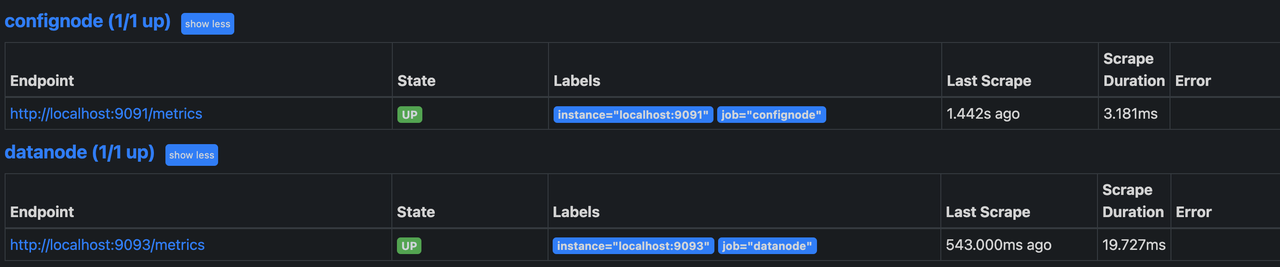
+4. Enter the http://localhost:9091/metrics URL in the browser, and you can
view the following monitoring item information:
+
+
+
+5. Similarly, the other two ConfigNode nodes can be configured to ports 9092
and 9093 respectively.
+
+### 1.1.3 Start DataNode
+1. Enter the `iotdb-enterprise-1.x.x.x-bin` package
+2. Modify the configuration file `conf/iotdb-datanode.properties` and modify
the following configuration. Other configurations remain unchanged:
+
+```properties
+dn_metric_reporter_list=PROMETHEUS
+dn_metric_level=IMPORTANT
+dn_metric_prometheus_reporter_port=9094
+```
+
+3. Run the script to start DataNode: `./sbin/start-datanode.sh`. If the
following prompt appears, the startup is successful:
-### clarification
+
+
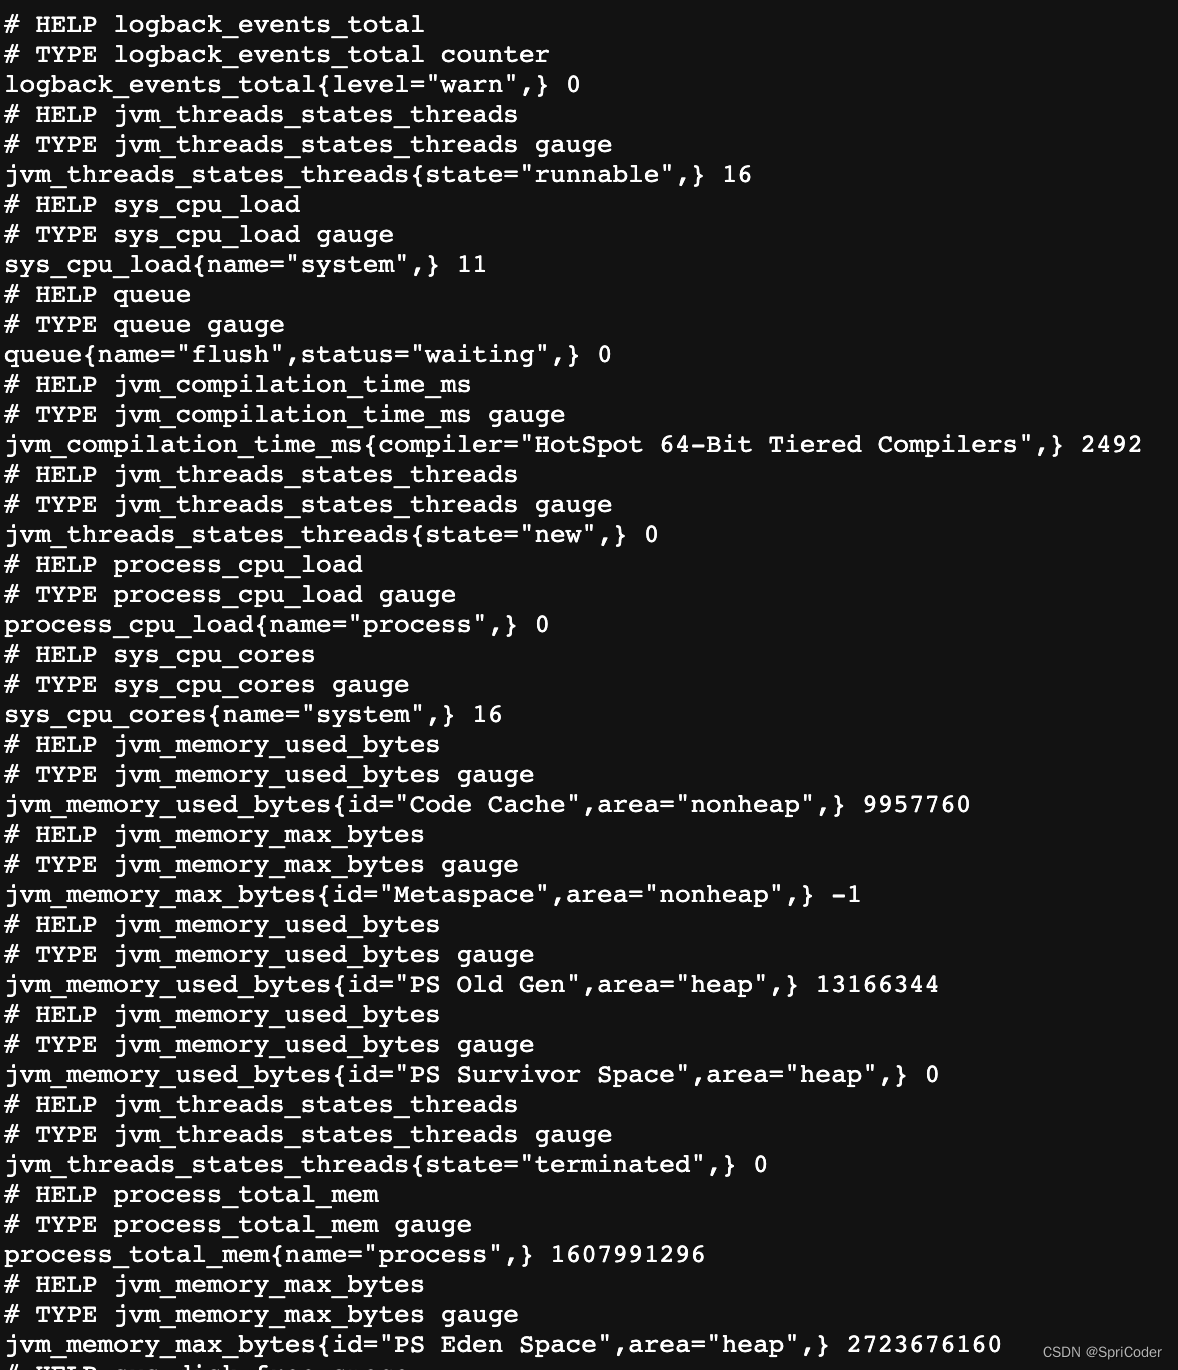
+4. Enter the `http://localhost:9094/metrics` URL in the browser, and you can
view the following monitoring item information:
+
+
+
+5. Similarly, the other two DataNodes can be configured to ports 9095 and 9096.
+
+### 1.1.4 clarification
+
+Please confirm that the IoTDB cluster has been started before performing the
following operations.
This doc will build the monitoring dashboard on one machine (1 ConfigNode and
1 DataNode) environment, other cluster configurations are similar, users can
adjust the configuration according to their own cluster situation (the number
of ConfigNode and DataNode). The basic configuration information of the cluster
built in this paper is shown in the table below.
| NODETYPE | NODEIP | Monitor Pusher | Monitor Level | Monitor Port |
| ---------- | --------- | -------------- | ------------ | --------- |
| ConfigNode | 127.0.0.1 | PROMETHEUS | IMPORTANT | 9091 |
-| DataNode | 127.0.0.1 | PROMETHEUS | IMPORTANT | 9093 |
+| ConfigNode | 127.0.0.1 | PROMETHEUS | IMPORTANT | 9092 |
+| ConfigNode | 127.0.0.1 | PROMETHEUS | IMPORTANT | 9093 |
+| DataNode | 127.0.0.1 | PROMETHEUS | IMPORTANT | 9094 |
+| DataNode | 127.0.0.1 | PROMETHEUS | IMPORTANT | 9095 |
+| DataNode | 127.0.0.1 | PROMETHEUS | IMPORTANT | 9096 |
-## configure Prometheus capture monitoring metrics
+## 1.2 configure Prometheus capture monitoring metrics
1. Download the installation package. Download the Prometheus binary package
locally, unzip it and go to the corresponding folder:
@@ -67,11 +109,11 @@ scrape_configs:
- targets: ["localhost:9090"]
- job_name: "confignode"
static_configs:
- - targets: ["localhost:9091"]
+ - targets: ["localhost:9091", "localhost:9092", "localhost:9093"]
honor_labels: true
- job_name: "datanode"
static_configs:
- - targets: ["localhost:9093"]
+ - targets: ["localhost:9094", "localhost:9095", "localhost:9096"]
honor_labels: true
```
@@ -88,9 +130,9 @@ scrape_configs:
-## Using Grafana to View Monitoring Data
+## 1.3 Using Grafana to View Monitoring Data
-### Step1:Grafana Installation, Configuration and Startup
+### 1.3.1 Step1:Grafana Installation, Configuration and Startup
1. Download the binary package of Grafana locally, unzip it and go to the
corresponding folder:
@@ -114,7 +156,7 @@ cd grafana-*
-### Step2:Use the official Grafana dashboard provided by IoTDB
+### 1.3.2 Step2:Import the Grafana Dashboards
1. Enter Grafana,click Browse of Dashboards
@@ -126,24 +168,31 @@ cd grafana-*
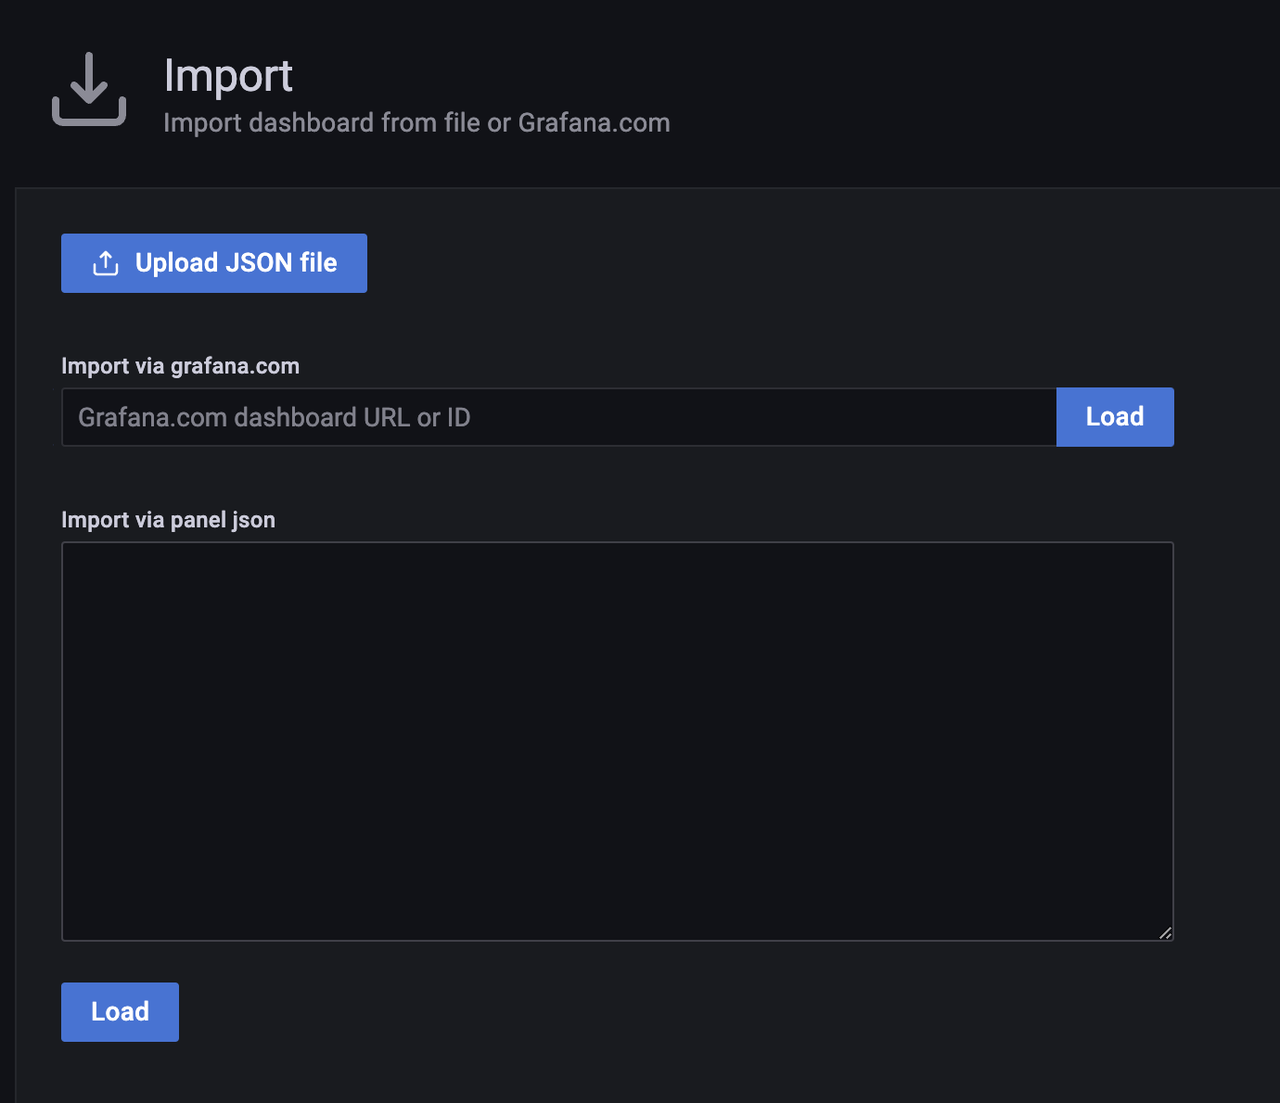
3. Select a way to import Dashboard
a. Upload the Json file of the downloaded Dashboard locally
- b. Enter the URL or ID of the Dashboard obtained from the Grafana website
- c. Paste the contents of the Dashboard's Json file
+ b. Paste the contents of the Dashboard's Json file
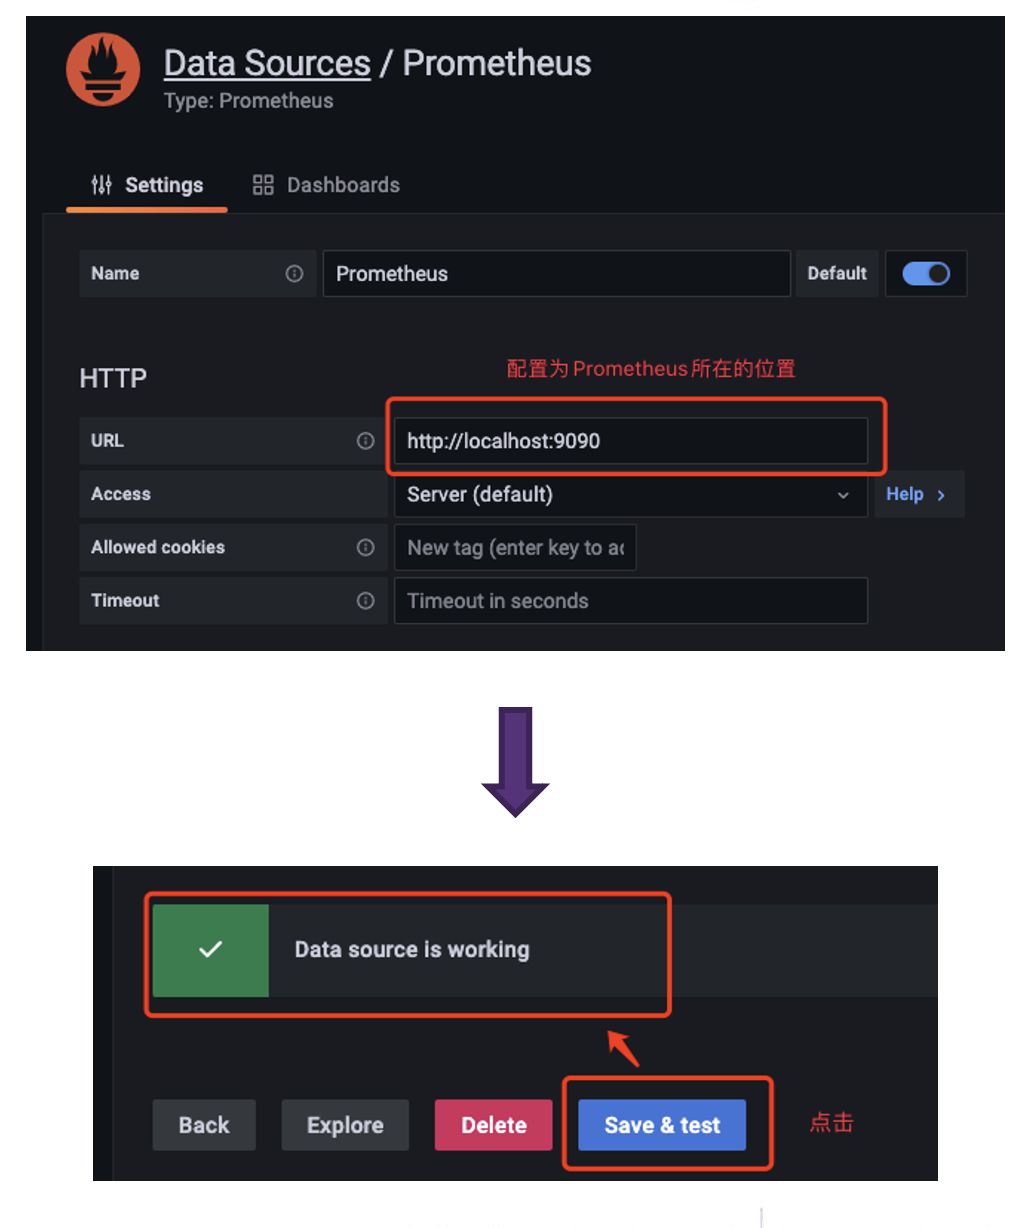
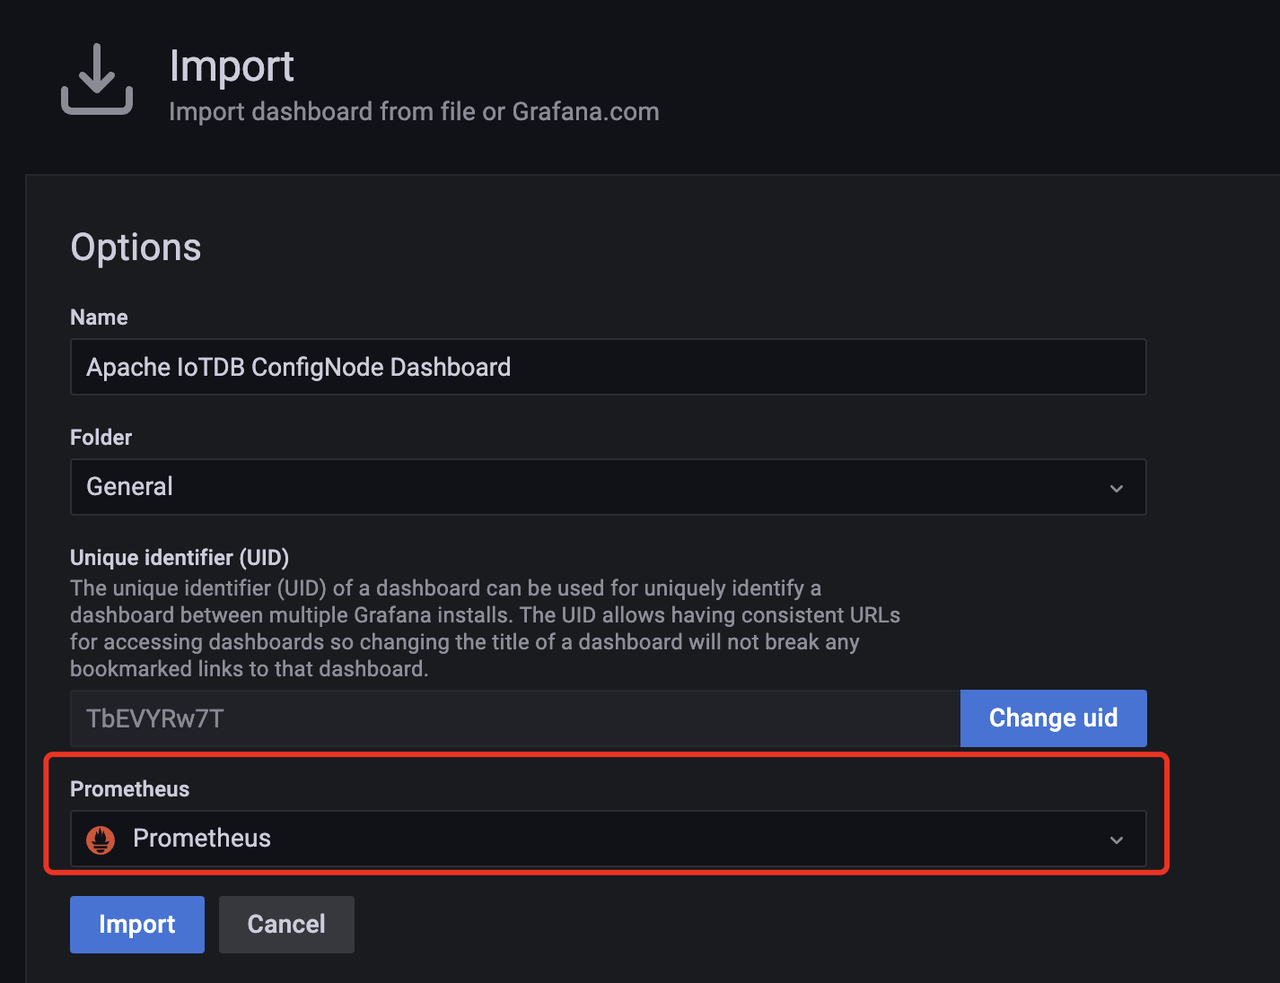
-4. Select Prometheus in the Dashboard as the Data Source you just configured
and click Import
+1. Select Prometheus in the Dashboard as the Data Source you just configured
and click Import
-5. Then enter Dashboard,select job to be ConfigNode,then following monitoring
dashboard will be seen:
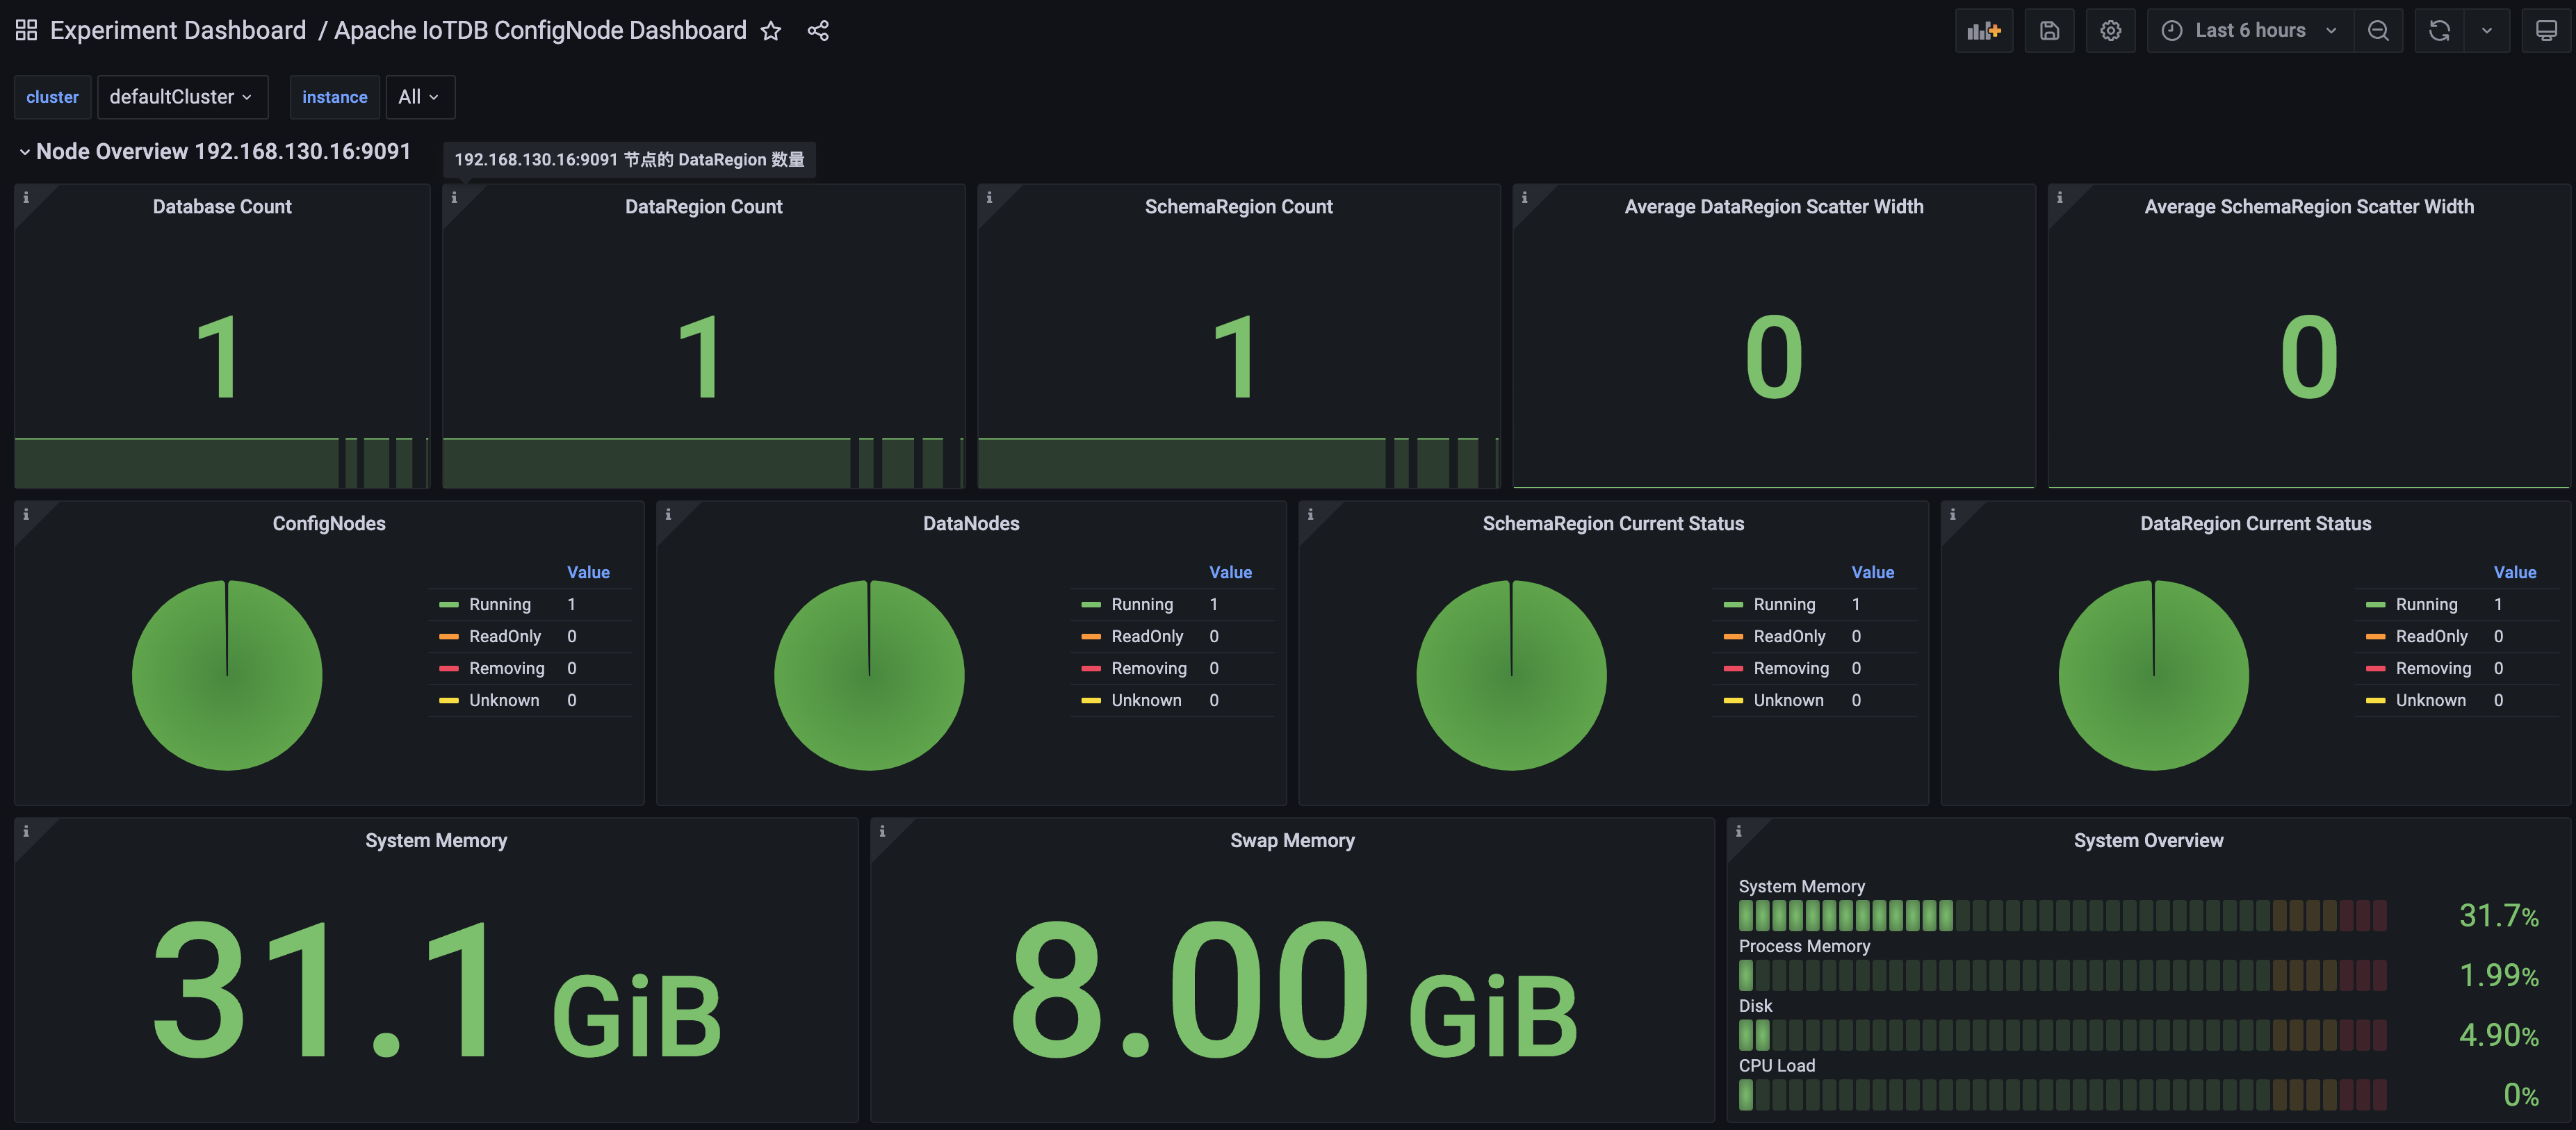
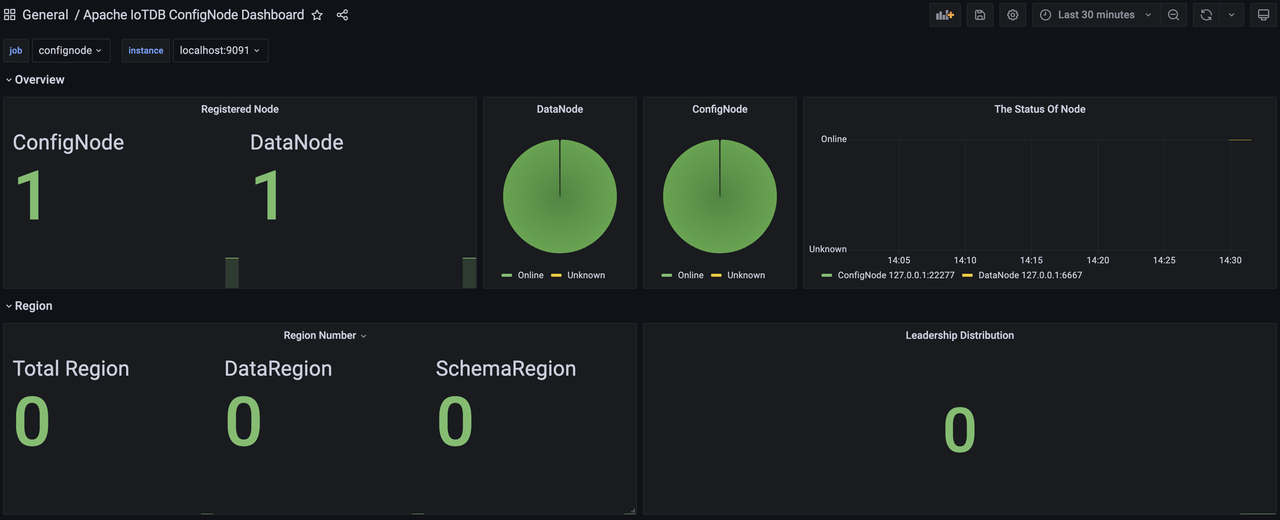
+5. Then enter the Apache ConfigNode Dashboard and see the following monitoring
panel
+
+
+
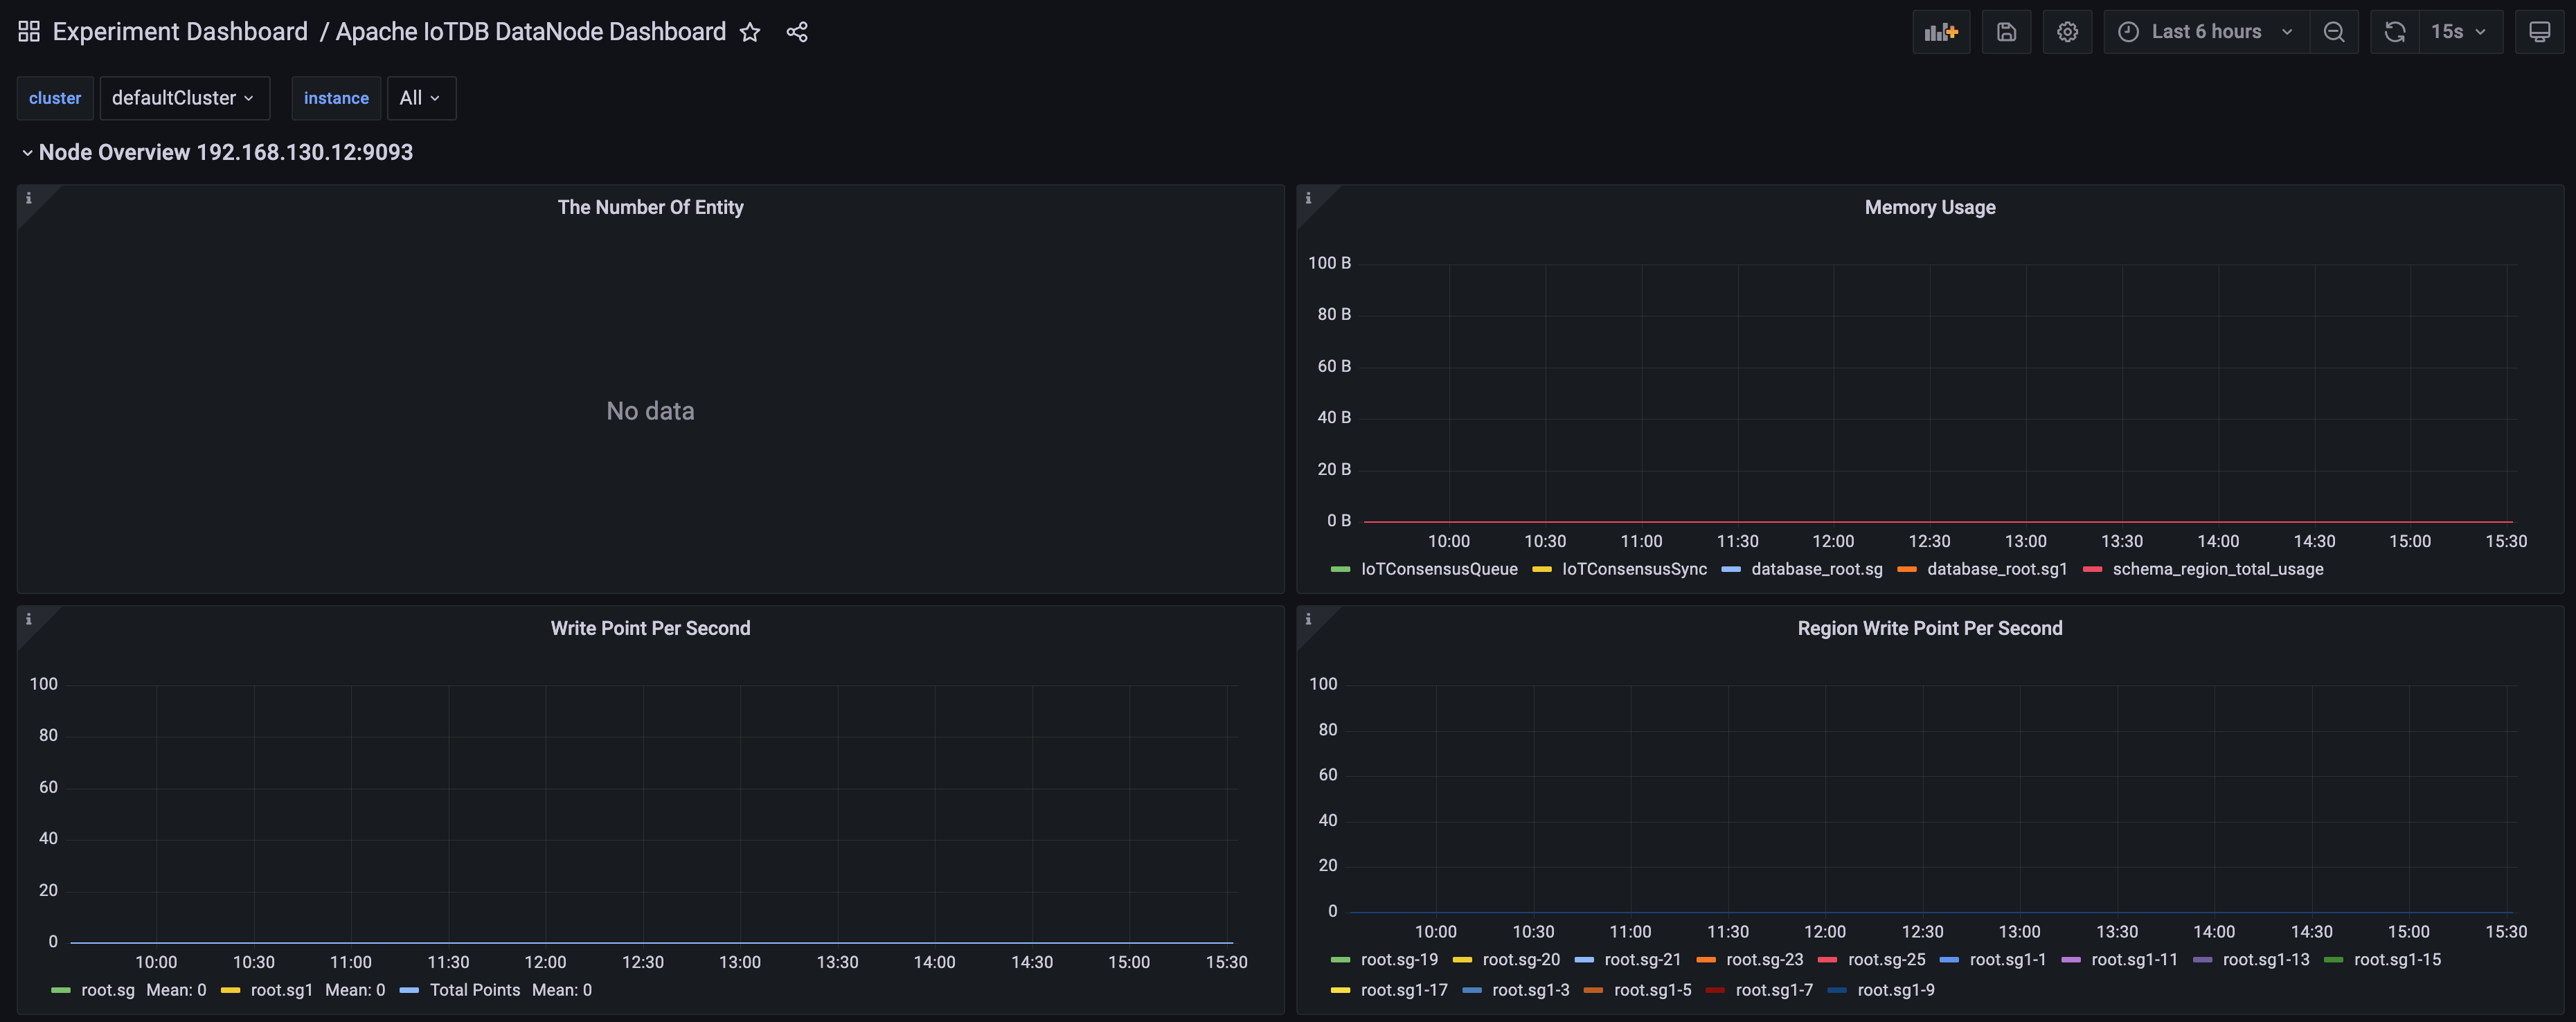
+6. Similarly, we can import Apache DataNode Dashboard and see the following
monitoring panel:
+
+
+
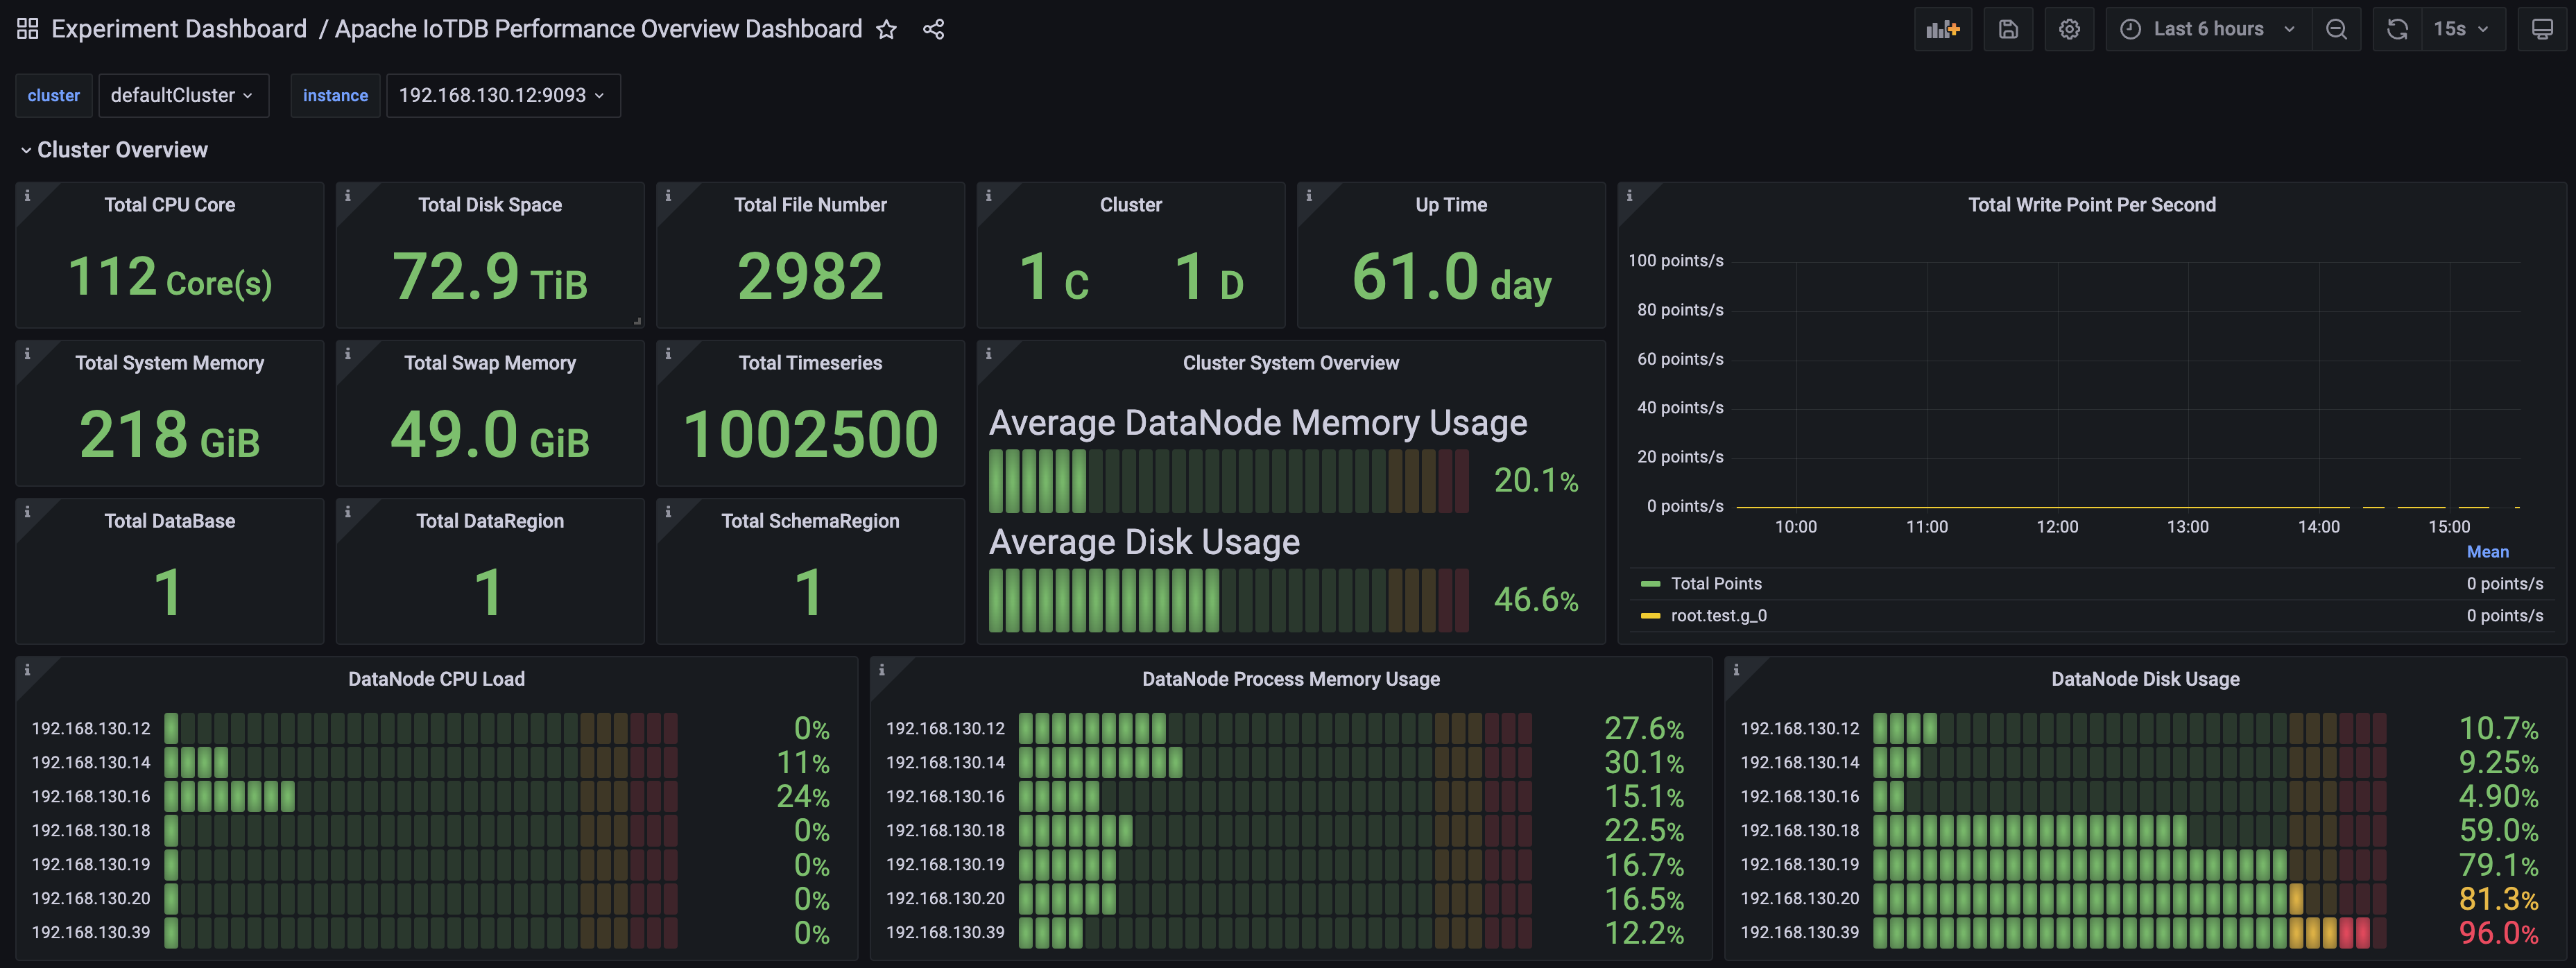
+7. Similarly, we can import the Apache Performance Overview Dashboard and see
the following monitoring panel:
-
+
-6. Similarly, we can import the Apache DataNode Dashboard, select job as
DataNode,then following monitoring dashboard will be seen:
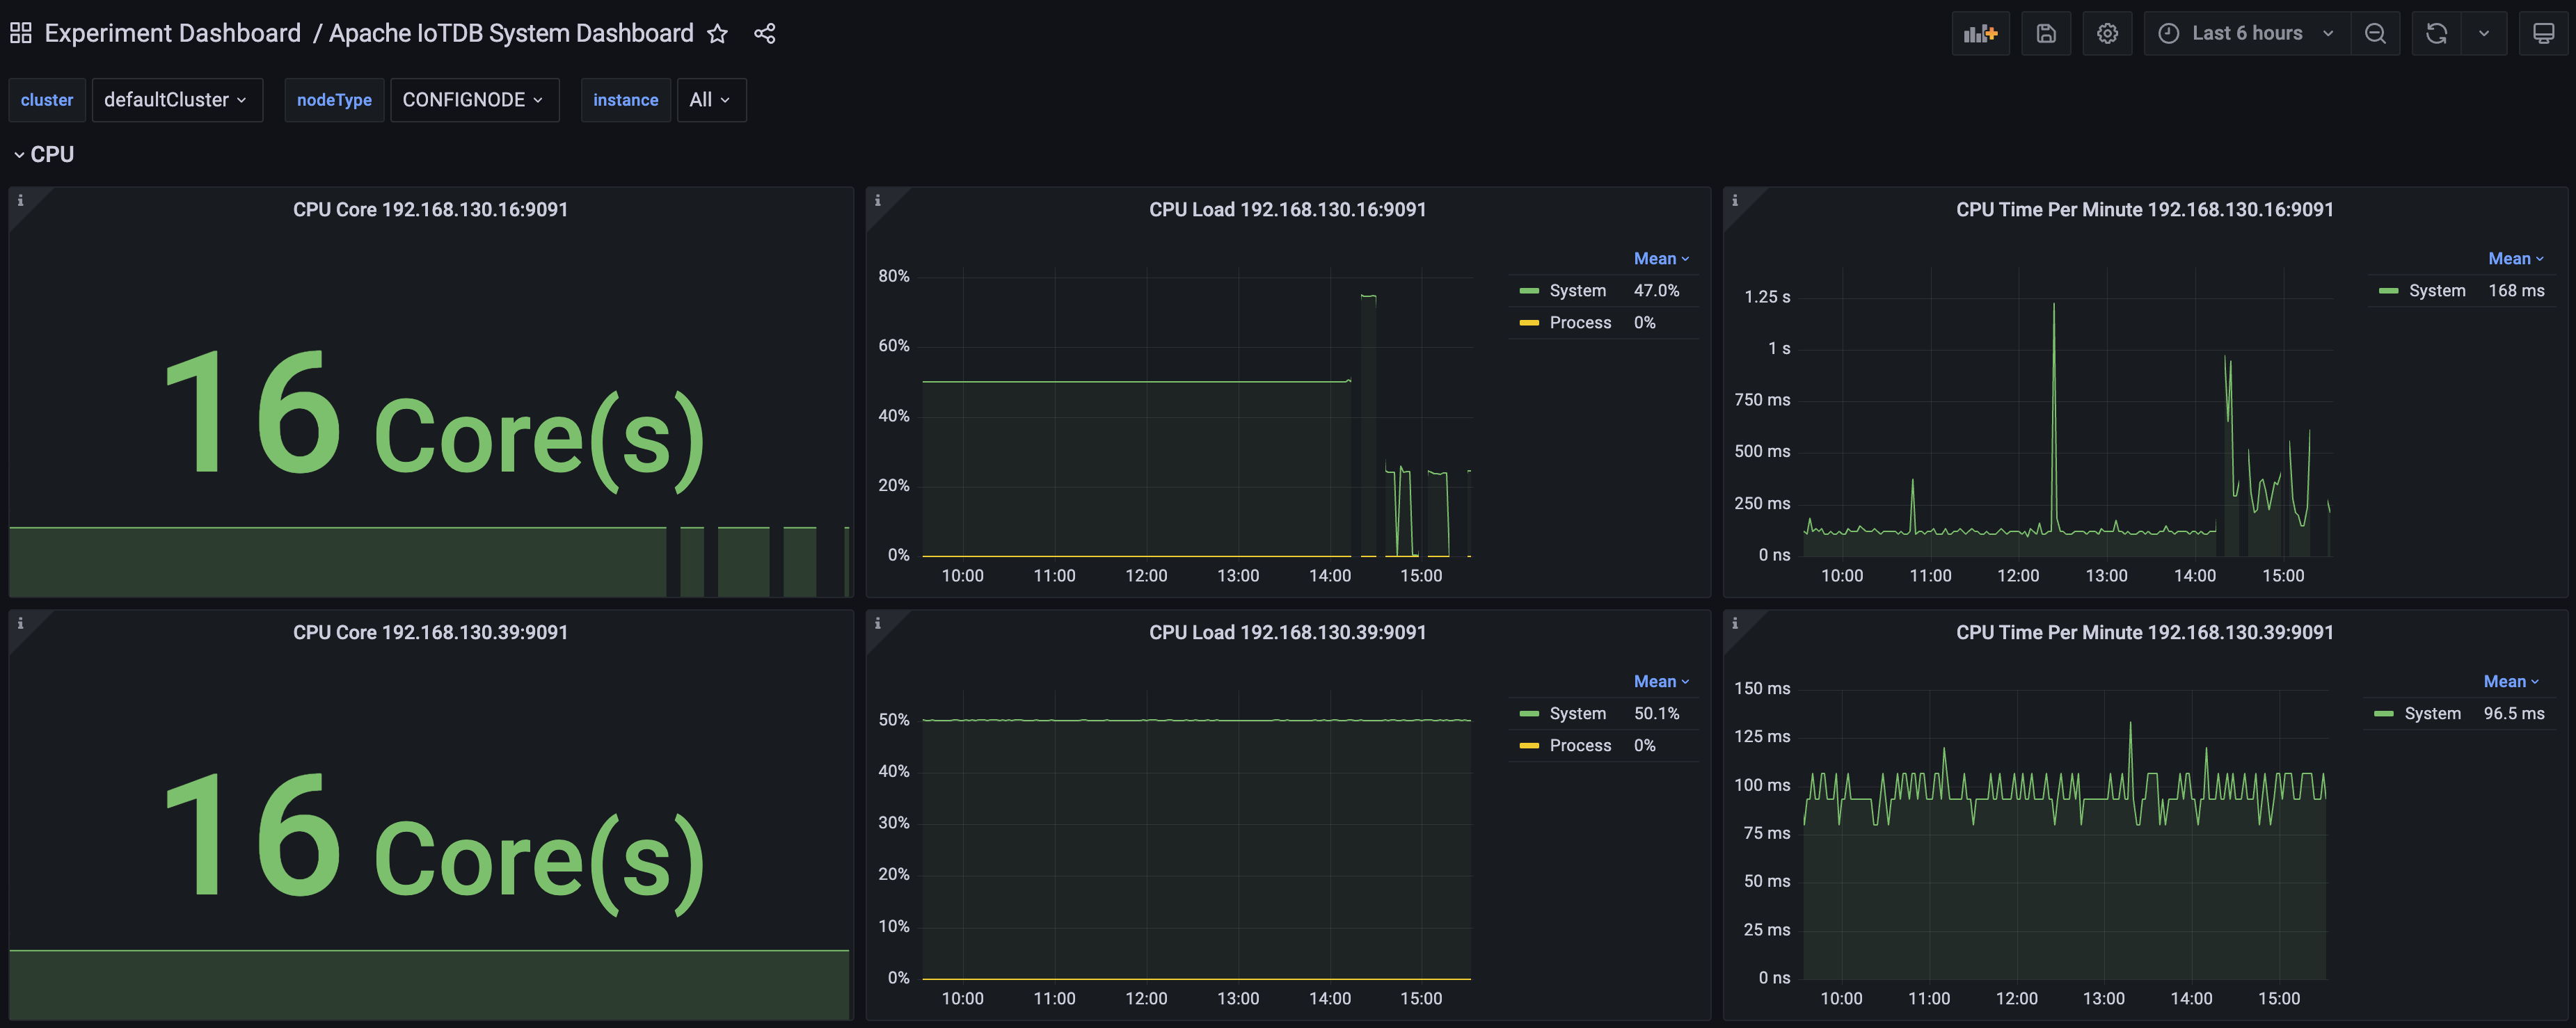
+8. Similarly, we can import the Apache System Overview Dashboard and see the
following monitoring panel:
-
+
-### Step3:Creating a new Dashboard for data visualisation
+### 1.3.3 Step3:Creating a new Dashboard for data visualisation
1. First create the Dashboard, then create the Panel.
diff --git
a/src/UserGuide/latest/Deployment-and-Maintenance/Monitoring-Board-Install-and-Deploy.md
b/src/UserGuide/latest/Deployment-and-Maintenance/Monitoring-Board-Install-and-Deploy.md
index 48a9ba2..38612f6 100644
---
a/src/UserGuide/latest/Deployment-and-Maintenance/Monitoring-Board-Install-and-Deploy.md
+++
b/src/UserGuide/latest/Deployment-and-Maintenance/Monitoring-Board-Install-and-Deploy.md
@@ -19,32 +19,74 @@
-->
-# Monitoring Board Install and Deploy
-From the Apache IoTDB 1.0 version, we introduced the system monitoring module,
you can complete the Apache IoTDB important operational indicators for
monitoring, this article describes how to open the system monitoring module in
the Apache IoTDB distribution, and the use of Prometheus + Grafana way to
complete the visualisation of the system monitoring indicators.
+# 1 Monitoring Board Install and Deploy
+From the IoTDB 1.0 version, we introduced the system monitoring module, you
can complete the IoTDB important operational indicators for monitoring, this
article describes how to open the system monitoring module in the IoTDB
distribution, and the use of Prometheus + Grafana way to complete the
visualisation of the system monitoring indicators.
-## pre-preparation
+## 1.1 pre-preparation
-### software requirement
+### 1.1.1 software requirement
-1. Apache IoTDB: version 1.0 and above, download from the official website:
https://iotdb.apache.org/Download/
+1. IoTDB: version 1.0 and above, you may contact your sales for the relevant
installer
2. Prometheus: version 2.30.3 and above, download from the official website:
https://prometheus.io/download/
3. Grafana: version 8.4.2 and above, download from the official website:
https://grafana.com/grafana/download
-4. IoTDB-Grafana installer: Grafana Dashboards is an TimechoDB(Enterprise
Edition based on IoTDB) tool, and you may contact your sales for the relevant
installer.
+4. Grafana Dashboards: Grafana Dashboard is a tool for Enterprise IoTDB, and
you may contact your sales for the relevant installer.
-### cluster requirement
+### 1.1.2 Start ConfigNode
+1. Enter the `iotdb-enterprise-1.x.x.x-bin` package
+2. Modify the configuration file `conf/iotdb-confignode.properties` and modify
the following configuration. Other configurations remain unchanged:
-Make sure that the IoTDB cluster is started before doing the following.
+```properties
+cn_metric_reporter_list=PROMETHEUS
+cn_metric_level=IMPORTANT
+cn_metric_prometheus_reporter_port=9091
+```
+
+3. Run the script to start ConfigNode: `./sbin/start-confignode.sh`. If the
following prompt appears, the startup is successful:
+
+
+
+4. Enter the http://localhost:9091/metrics URL in the browser, and you can
view the following monitoring item information:
+
+
+
+5. Similarly, the other two ConfigNode nodes can be configured to ports 9092
and 9093 respectively.
+
+### 1.1.3 Start DataNode
+1. Enter the `iotdb-enterprise-1.x.x.x-bin` package
+2. Modify the configuration file `conf/iotdb-datanode.properties` and modify
the following configuration. Other configurations remain unchanged:
+
+```properties
+dn_metric_reporter_list=PROMETHEUS
+dn_metric_level=IMPORTANT
+dn_metric_prometheus_reporter_port=9094
+```
+
+3. Run the script to start DataNode: `./sbin/start-datanode.sh`. If the
following prompt appears, the startup is successful:
-### clarification
+
+
+4. Enter the `http://localhost:9094/metrics` URL in the browser, and you can
view the following monitoring item information:
+
+
+
+5. Similarly, the other two DataNodes can be configured to ports 9095 and 9096.
+
+### 1.1.4 clarification
+
+Please confirm that the IoTDB cluster has been started before performing the
following operations.
This doc will build the monitoring dashboard on one machine (1 ConfigNode and
1 DataNode) environment, other cluster configurations are similar, users can
adjust the configuration according to their own cluster situation (the number
of ConfigNode and DataNode). The basic configuration information of the cluster
built in this paper is shown in the table below.
| NODETYPE | NODEIP | Monitor Pusher | Monitor Level | Monitor Port |
| ---------- | --------- | -------------- | ------------ | --------- |
| ConfigNode | 127.0.0.1 | PROMETHEUS | IMPORTANT | 9091 |
-| DataNode | 127.0.0.1 | PROMETHEUS | IMPORTANT | 9093 |
+| ConfigNode | 127.0.0.1 | PROMETHEUS | IMPORTANT | 9092 |
+| ConfigNode | 127.0.0.1 | PROMETHEUS | IMPORTANT | 9093 |
+| DataNode | 127.0.0.1 | PROMETHEUS | IMPORTANT | 9094 |
+| DataNode | 127.0.0.1 | PROMETHEUS | IMPORTANT | 9095 |
+| DataNode | 127.0.0.1 | PROMETHEUS | IMPORTANT | 9096 |
-## configure Prometheus capture monitoring metrics
+## 1.2 configure Prometheus capture monitoring metrics
1. Download the installation package. Download the Prometheus binary package
locally, unzip it and go to the corresponding folder:
@@ -67,11 +109,11 @@ scrape_configs:
- targets: ["localhost:9090"]
- job_name: "confignode"
static_configs:
- - targets: ["localhost:9091"]
+ - targets: ["localhost:9091", "localhost:9092", "localhost:9093"]
honor_labels: true
- job_name: "datanode"
static_configs:
- - targets: ["localhost:9093"]
+ - targets: ["localhost:9094", "localhost:9095", "localhost:9096"]
honor_labels: true
```
@@ -88,9 +130,9 @@ scrape_configs:
-## Using Grafana to View Monitoring Data
+## 1.3 Using Grafana to View Monitoring Data
-### Step1:Grafana Installation, Configuration and Startup
+### 1.3.1 Step1:Grafana Installation, Configuration and Startup
1. Download the binary package of Grafana locally, unzip it and go to the
corresponding folder:
@@ -114,7 +156,7 @@ cd grafana-*

-### Step2:Use the official Grafana dashboard provided by IoTDB
+### 1.3.2 Step2:Import the Grafana Dashboards
1. Enter Grafana,click Browse of Dashboards
@@ -126,24 +168,31 @@ cd grafana-*
3. Select a way to import Dashboard
a. Upload the Json file of the downloaded Dashboard locally
- b. Enter the URL or ID of the Dashboard obtained from the Grafana website
- c. Paste the contents of the Dashboard's Json file
+ b. Paste the contents of the Dashboard's Json file

-4. Select Prometheus in the Dashboard as the Data Source you just configured
and click Import
+1. Select Prometheus in the Dashboard as the Data Source you just configured
and click Import

-5. Then enter Dashboard,select job to be ConfigNode,then following monitoring
dashboard will be seen:
+5. Then enter the Apache ConfigNode Dashboard and see the following monitoring
panel
+
+
+
+6. Similarly, we can import Apache DataNode Dashboard and see the following
monitoring panel:
+
+
+
+7. Similarly, we can import the Apache Performance Overview Dashboard and see
the following monitoring panel:
-
+
-6. Similarly, we can import the Apache DataNode Dashboard, select job as
DataNode,then following monitoring dashboard will be seen:
+8. Similarly, we can import the Apache System Overview Dashboard and see the
following monitoring panel:
-
+
-### Step3:Creating a new Dashboard for data visualisation
+### 1.3.3 Step3:Creating a new Dashboard for data visualisation
1. First create the Dashboard, then create the Panel.
diff --git
a/src/zh/UserGuide/Master/Deployment-and-Maintenance/Monitoring-Board-Install-and-Deploy.md
b/src/zh/UserGuide/Master/Deployment-and-Maintenance/Monitoring-Board-Install-and-Deploy.md
index 3a5a86b..9ed81e2 100644
---
a/src/zh/UserGuide/Master/Deployment-and-Maintenance/Monitoring-Board-Install-and-Deploy.md
+++
b/src/zh/UserGuide/Master/Deployment-and-Maintenance/Monitoring-Board-Install-and-Deploy.md
@@ -19,32 +19,76 @@
-->
-# 监控面板安装部署
-从 Apache IoTDB 1.0 版本开始,我们引入了系统监控模块,可以完成对 Apache IoTDB 的重要运行指标进行监控,本文介绍了如何在
Apache IoTDB 分布式开启系统监控模块,并且使用 Prometheus + Grafana 的方式完成对系统监控指标的可视化。
+# 1. 监控面板安装部署
+从 IoTDB 1.0 版本开始,我们引入了系统监控模块,可以完成对 IoTDB 的重要运行指标进行监控,本文介绍了如何在 IoTDB
分布式开启系统监控模块,并且使用 Prometheus + Grafana 的方式完成对系统监控指标的可视化。
-## 前期准备
+## 1.1 前期准备
-### 软件要求
+### 1.1.1 软件要求
-1. Apache IoTDB:1.0 版本及以上,可以前往官网下载:https://iotdb.apache.org/Download/
+1. IoTDB:1.0 版本及以上,可以前往官网下载:https://iotdb.apache.org/Download/
2. Prometheus:2.30.3 版本及以上,可以前往官网下载:https://prometheus.io/download/
3. Grafana:8.4.2 版本及以上,可以前往官网下载:https://grafana.com/grafana/download
-4. IoTDB-Grafana安装包:Grafana看板为TimechoDB(基于IoTDB的企业版数据库)工具,您可联系您的销售获取相关安装包
+4. Grafana监控面板:基于企业版IoTDB的数据库工具,您可联系商务获取
-### 集群要求
+### 1.1.2 启动 ConfigNode
+> 本文以 3C3D 为例
-进行以下操作前请确认IoTDB集群已启动。
+1. 进入`iotdb-enterprise-1.3.x.x-bin`包
+2. 修改配置文件`conf/iotdb-confignode.properties`,修改如下配置,其他配置保持不变:
+
+```properties
+cn_metric_reporter_list=PROMETHEUS
+cn_metric_level=IMPORTANT
+cn_metric_prometheus_reporter_port=9091
+```
+
+3. 运行脚本启动 ConfigNode:`./sbin/start-confignode.sh`,出现如下提示则为启动成功:
+
+
+
+4. 在浏览器进入http://localhost:9091/metrics网址,可以查看到如下的监控项信息:
+
+
+
+5. 同样地,另外两个 ConfigNode 节点可以分别配置到 9092 和 9093 端口。
+
+### 1.1.3 启动 DataNode
+1. 进入`iotdb-enterprise-1.3.x.x-bin`包
+2. 修改配置文件`conf/iotdb-datanode.properties`,修改如下配置,其他配置保持不变:
+
+```properties
+dn_metric_reporter_list=PROMETHEUS
+dn_metric_level=IMPORTANT
+dn_metric_prometheus_reporter_port=9094
+```
+
+3. 运行脚本启动 DataNode:`./sbin/start-datanode.sh`,出现如下提示则为启动成功:
-### 说明
+
-本文将在一台机器(1 个 ConfigNode 和 1 个
DataNode)环境上进行监控面板搭建,其他集群配置是类似的,用户可以根据自己的集群情况(ConfigNode 和 DataNode
的数量)进行配置调整。本文搭建的集群的基本配置信息如下表所示。
+4. 在浏览器进入`http://localhost:9094/metrics`网址,可以查看到如下的监控项信息:
+
+
+
+5. 同样地,另外两个 DataNode 可以配置到 9095 和 9096 端口。
+
+### 1.1.4 说明
+
+进行以下操作前请确认IoTDB集群已启动。
+
+本文将在一台机器(3 个 ConfigNode 和 3 个
DataNode)环境上进行监控面板搭建,其他集群配置是类似的,用户可以根据自己的集群情况(ConfigNode 和 DataNode
的数量)进行配置调整。本文搭建的集群的基本配置信息如下表所示。
| 集群角色 | 节点IP | 监控模块推送器 | 监控模块级别 | 监控 Port |
| ---------- | --------- | -------------- | ------------ | --------- |
| ConfigNode | 127.0.0.1 | PROMETHEUS | IMPORTANT | 9091 |
-| DataNode | 127.0.0.1 | PROMETHEUS | IMPORTANT | 9093 |
+| ConfigNode | 127.0.0.1 | PROMETHEUS | IMPORTANT | 9092 |
+| ConfigNode | 127.0.0.1 | PROMETHEUS | IMPORTANT | 9093 |
+| DataNode | 127.0.0.1 | PROMETHEUS | IMPORTANT | 9094 |
+| DataNode | 127.0.0.1 | PROMETHEUS | IMPORTANT | 9095 |
+| DataNode | 127.0.0.1 | PROMETHEUS | IMPORTANT | 9096 |
-## 配置 Prometheus 采集监控指标
+## 1.2 配置 Prometheus 采集监控指标
1. 下载安装包。下载Prometheus的二进制包到本地,解压后进入对应文件夹:
@@ -67,11 +111,11 @@ scrape_configs:
- targets: ["localhost:9090"]
- job_name: "confignode"
static_configs:
- - targets: ["localhost:9091"]
+ - targets: ["localhost:9091", "localhost:9092", "localhost:9093"]
honor_labels: true
- job_name: "datanode"
static_configs:
- - targets: ["localhost:9093"]
+ - targets: ["localhost:9094", "localhost:9095", "localhost:9096"]
honor_labels: true
```
@@ -86,11 +130,9 @@ scrape_configs:
+## 1.3 使用 Grafana 查看监控数据
-
-## 使用 Grafana 查看监控数据
-
-### Step1:Grafana 安装、配置与启动
+### 1.3.1 Step1:Grafana 安装、配置与启动
1. 下载Grafana的二进制包到本地,解压后进入对应文件夹:
@@ -114,7 +156,7 @@ cd grafana-*

-### Step2:使用IoTDB官方提供的Grafana看板
+### 1.3.2 Step2:导入IoTDB官方提供的Grafana看板
1. 进入 Grafana,选择 Dashboards 的 Browse
@@ -126,24 +168,31 @@ cd grafana-*
3. 选择一种方式导入 Dashboard
a. 上传本地已下载的 Dashboard 的 Json 文件
- b. 输入 Grafana 官网获取到的 Dashboard 的 URL 或者 ID
- c. 将 Dashboard 的 Json 文件内容直接粘贴进入
+ b. 将 Dashboard 的 Json 文件内容直接粘贴进入

-4. 选择 Dashboard 的 Prometheus 为刚刚配置好的 Data Source,然后点击 Import
+1. 选择 Dashboard 的 Prometheus 为刚刚配置好的 Data Source,然后点击 Import

-5. 之后进入 Dashboard,选择 job 为 ConfigNode,就看到如下的监控面板
+5. 之后进入 Apache ConfigNode Dashboard,就看到如下的监控面板
+
+
+
+6. 同样,我们可以导入 Apache DataNode Dashboard,看到如下的监控面板:
+
+
+
+7. 同样,我们可以导入 Apache Performance Overview Dashboard,看到如下的监控面板:
-
+
-6. 同样地,我们可以导入 Apache DataNode Dashboard,选择 job 为 DataNode,就看到如下的监控面板:
+8. 同样,我们可以导入 Apache System Overview Dashboard,看到如下的监控面板:
-
+
-### Step3:创建新的 Dashboard 进行数据可视化
+### 1.3.3 Step3:创建新的 Dashboard 进行数据可视化
1. 首先创建Dashboard,然后创建Panel
diff --git
a/src/zh/UserGuide/latest/Deployment-and-Maintenance/Monitoring-Board-Install-and-Deploy.md
b/src/zh/UserGuide/latest/Deployment-and-Maintenance/Monitoring-Board-Install-and-Deploy.md
index 3a5a86b..9ed81e2 100644
---
a/src/zh/UserGuide/latest/Deployment-and-Maintenance/Monitoring-Board-Install-and-Deploy.md
+++
b/src/zh/UserGuide/latest/Deployment-and-Maintenance/Monitoring-Board-Install-and-Deploy.md
@@ -19,32 +19,76 @@
-->
-# 监控面板安装部署
-从 Apache IoTDB 1.0 版本开始,我们引入了系统监控模块,可以完成对 Apache IoTDB 的重要运行指标进行监控,本文介绍了如何在
Apache IoTDB 分布式开启系统监控模块,并且使用 Prometheus + Grafana 的方式完成对系统监控指标的可视化。
+# 1. 监控面板安装部署
+从 IoTDB 1.0 版本开始,我们引入了系统监控模块,可以完成对 IoTDB 的重要运行指标进行监控,本文介绍了如何在 IoTDB
分布式开启系统监控模块,并且使用 Prometheus + Grafana 的方式完成对系统监控指标的可视化。
-## 前期准备
+## 1.1 前期准备
-### 软件要求
+### 1.1.1 软件要求
-1. Apache IoTDB:1.0 版本及以上,可以前往官网下载:https://iotdb.apache.org/Download/
+1. IoTDB:1.0 版本及以上,可以前往官网下载:https://iotdb.apache.org/Download/
2. Prometheus:2.30.3 版本及以上,可以前往官网下载:https://prometheus.io/download/
3. Grafana:8.4.2 版本及以上,可以前往官网下载:https://grafana.com/grafana/download
-4. IoTDB-Grafana安装包:Grafana看板为TimechoDB(基于IoTDB的企业版数据库)工具,您可联系您的销售获取相关安装包
+4. Grafana监控面板:基于企业版IoTDB的数据库工具,您可联系商务获取
-### 集群要求
+### 1.1.2 启动 ConfigNode
+> 本文以 3C3D 为例
-进行以下操作前请确认IoTDB集群已启动。
+1. 进入`iotdb-enterprise-1.3.x.x-bin`包
+2. 修改配置文件`conf/iotdb-confignode.properties`,修改如下配置,其他配置保持不变:
+
+```properties
+cn_metric_reporter_list=PROMETHEUS
+cn_metric_level=IMPORTANT
+cn_metric_prometheus_reporter_port=9091
+```
+
+3. 运行脚本启动 ConfigNode:`./sbin/start-confignode.sh`,出现如下提示则为启动成功:
+
+
+
+4. 在浏览器进入http://localhost:9091/metrics网址,可以查看到如下的监控项信息:
+
+
+
+5. 同样地,另外两个 ConfigNode 节点可以分别配置到 9092 和 9093 端口。
+
+### 1.1.3 启动 DataNode
+1. 进入`iotdb-enterprise-1.3.x.x-bin`包
+2. 修改配置文件`conf/iotdb-datanode.properties`,修改如下配置,其他配置保持不变:
+
+```properties
+dn_metric_reporter_list=PROMETHEUS
+dn_metric_level=IMPORTANT
+dn_metric_prometheus_reporter_port=9094
+```
+
+3. 运行脚本启动 DataNode:`./sbin/start-datanode.sh`,出现如下提示则为启动成功:
-### 说明
+
-本文将在一台机器(1 个 ConfigNode 和 1 个
DataNode)环境上进行监控面板搭建,其他集群配置是类似的,用户可以根据自己的集群情况(ConfigNode 和 DataNode
的数量)进行配置调整。本文搭建的集群的基本配置信息如下表所示。
+4. 在浏览器进入`http://localhost:9094/metrics`网址,可以查看到如下的监控项信息:
+
+
+
+5. 同样地,另外两个 DataNode 可以配置到 9095 和 9096 端口。
+
+### 1.1.4 说明
+
+进行以下操作前请确认IoTDB集群已启动。
+
+本文将在一台机器(3 个 ConfigNode 和 3 个
DataNode)环境上进行监控面板搭建,其他集群配置是类似的,用户可以根据自己的集群情况(ConfigNode 和 DataNode
的数量)进行配置调整。本文搭建的集群的基本配置信息如下表所示。
| 集群角色 | 节点IP | 监控模块推送器 | 监控模块级别 | 监控 Port |
| ---------- | --------- | -------------- | ------------ | --------- |
| ConfigNode | 127.0.0.1 | PROMETHEUS | IMPORTANT | 9091 |
-| DataNode | 127.0.0.1 | PROMETHEUS | IMPORTANT | 9093 |
+| ConfigNode | 127.0.0.1 | PROMETHEUS | IMPORTANT | 9092 |
+| ConfigNode | 127.0.0.1 | PROMETHEUS | IMPORTANT | 9093 |
+| DataNode | 127.0.0.1 | PROMETHEUS | IMPORTANT | 9094 |
+| DataNode | 127.0.0.1 | PROMETHEUS | IMPORTANT | 9095 |
+| DataNode | 127.0.0.1 | PROMETHEUS | IMPORTANT | 9096 |
-## 配置 Prometheus 采集监控指标
+## 1.2 配置 Prometheus 采集监控指标
1. 下载安装包。下载Prometheus的二进制包到本地,解压后进入对应文件夹:
@@ -67,11 +111,11 @@ scrape_configs:
- targets: ["localhost:9090"]
- job_name: "confignode"
static_configs:
- - targets: ["localhost:9091"]
+ - targets: ["localhost:9091", "localhost:9092", "localhost:9093"]
honor_labels: true
- job_name: "datanode"
static_configs:
- - targets: ["localhost:9093"]
+ - targets: ["localhost:9094", "localhost:9095", "localhost:9096"]
honor_labels: true
```
@@ -86,11 +130,9 @@ scrape_configs:


+## 1.3 使用 Grafana 查看监控数据
-
-## 使用 Grafana 查看监控数据
-
-### Step1:Grafana 安装、配置与启动
+### 1.3.1 Step1:Grafana 安装、配置与启动
1. 下载Grafana的二进制包到本地,解压后进入对应文件夹:
@@ -114,7 +156,7 @@ cd grafana-*

-### Step2:使用IoTDB官方提供的Grafana看板
+### 1.3.2 Step2:导入IoTDB官方提供的Grafana看板
1. 进入 Grafana,选择 Dashboards 的 Browse
@@ -126,24 +168,31 @@ cd grafana-*
3. 选择一种方式导入 Dashboard
a. 上传本地已下载的 Dashboard 的 Json 文件
- b. 输入 Grafana 官网获取到的 Dashboard 的 URL 或者 ID
- c. 将 Dashboard 的 Json 文件内容直接粘贴进入
+ b. 将 Dashboard 的 Json 文件内容直接粘贴进入

-4. 选择 Dashboard 的 Prometheus 为刚刚配置好的 Data Source,然后点击 Import
+1. 选择 Dashboard 的 Prometheus 为刚刚配置好的 Data Source,然后点击 Import

-5. 之后进入 Dashboard,选择 job 为 ConfigNode,就看到如下的监控面板
+5. 之后进入 Apache ConfigNode Dashboard,就看到如下的监控面板
+
+
+
+6. 同样,我们可以导入 Apache DataNode Dashboard,看到如下的监控面板:
+
+
+
+7. 同样,我们可以导入 Apache Performance Overview Dashboard,看到如下的监控面板:
-
+
-6. 同样地,我们可以导入 Apache DataNode Dashboard,选择 job 为 DataNode,就看到如下的监控面板:
+8. 同样,我们可以导入 Apache System Overview Dashboard,看到如下的监控面板:
-
+
-### Step3:创建新的 Dashboard 进行数据可视化
+### 1.3.3 Step3:创建新的 Dashboard 进行数据可视化
1. 首先创建Dashboard,然后创建Panel