This is an automated email from the ASF dual-hosted git repository.

caogaofei pushed a commit to branch main
in repository https://gitbox.apache.org/repos/asf/iotdb-docs.git
The following commit(s) were added to refs/heads/main by this push:
new 1fa6656 Add "Entering TimeSeries Data" document
1fa6656 is described below
commit 1fa6656b352b3ec559ba7bec1df71de82388654b
Author: majialin <[email protected]>
AuthorDate: Tue Jun 25 15:03:17 2024 +0800
Add "Entering TimeSeries Data" document
---
src/.vuepress/sidebar/V1.3.x/en.ts | 1 +
src/.vuepress/sidebar/V1.3.x/zh.ts | 1 +
src/.vuepress/sidebar_timecho/V1.3.x/en.ts | 1 +
src/.vuepress/sidebar_timecho/V1.3.x/zh.ts | 1 +
.../Basic-Concept/Navigating_Time_Series_Data.md | 64 +++++++++++++++++++++
.../Basic-Concept/Navigating_Time_Series_Data.md | 65 +++++++++++++++++++++
.../Basic-Concept/Navigating_Time_Series_Data.md | 67 ++++++++++++++++++++++
.../Basic-Concept/Navigating_Time_Series_Data.md | 67 ++++++++++++++++++++++
8 files changed, 267 insertions(+)
diff --git a/src/.vuepress/sidebar/V1.3.x/en.ts
b/src/.vuepress/sidebar/V1.3.x/en.ts
index 5dfd779..76402f9 100644
--- a/src/.vuepress/sidebar/V1.3.x/en.ts
+++ b/src/.vuepress/sidebar/V1.3.x/en.ts
@@ -54,6 +54,7 @@ export const enSidebar = {
prefix: 'Basic-Concept/',
// children: 'structure',
children: [
+ { text: 'Navigating Time Series Data', link:
'Navigating_Time_Series_Data' },
{ text: 'Data Model and Terminology', link:
'Data-Model-and-Terminology' },
{ text: 'Data Type', link: 'Data-Type' },
{ text: 'Encoding and Compression', link: 'Encoding-and-Compression' },
diff --git a/src/.vuepress/sidebar/V1.3.x/zh.ts
b/src/.vuepress/sidebar/V1.3.x/zh.ts
index ac51d8d..2593c6c 100644
--- a/src/.vuepress/sidebar/V1.3.x/zh.ts
+++ b/src/.vuepress/sidebar/V1.3.x/zh.ts
@@ -54,6 +54,7 @@ export const zhSidebar = {
prefix: 'Basic-Concept/',
// children: 'structure',
children: [
+ { text: '走进时序数据', link: 'Navigating_Time_Series_Data' },
{ text: '数据模型', link: 'Data-Model-and-Terminology' },
{ text: '数据类型', link: 'Data-Type' },
{ text: '编码和压缩', link: 'Encoding-and-Compression' },
diff --git a/src/.vuepress/sidebar_timecho/V1.3.x/en.ts
b/src/.vuepress/sidebar_timecho/V1.3.x/en.ts
index 04fa7d3..266064e 100644
--- a/src/.vuepress/sidebar_timecho/V1.3.x/en.ts
+++ b/src/.vuepress/sidebar_timecho/V1.3.x/en.ts
@@ -54,6 +54,7 @@ export const enSidebar = {
prefix: 'Basic-Concept/',
// children: 'structure',
children: [
+ { text: 'Navigating Time Series Data', link:
'Navigating_Time_Series_Data' },
{ text: 'Data Model and Terminology', link:
'Data-Model-and-Terminology' },
{ text: 'Data Type', link: 'Data-Type' },
{ text: 'Encoding and Compression', link: 'Encoding-and-Compression' },
diff --git a/src/.vuepress/sidebar_timecho/V1.3.x/zh.ts
b/src/.vuepress/sidebar_timecho/V1.3.x/zh.ts
index 153f819..a7f0d9f 100644
--- a/src/.vuepress/sidebar_timecho/V1.3.x/zh.ts
+++ b/src/.vuepress/sidebar_timecho/V1.3.x/zh.ts
@@ -54,6 +54,7 @@ export const zhSidebar = {
prefix: 'Basic-Concept/',
// children: 'structure',
children: [
+ { text: '走进时序数据', link: 'Navigating_Time_Series_Data' },
{ text: '数据模型', link: 'Data-Model-and-Terminology' },
{ text: '数据类型', link: 'Data-Type' },
{ text: '编码和压缩', link: 'Encoding-and-Compression' },
diff --git a/src/UserGuide/Master/Basic-Concept/Navigating_Time_Series_Data.md
b/src/UserGuide/Master/Basic-Concept/Navigating_Time_Series_Data.md
new file mode 100644
index 0000000..20aaef3
--- /dev/null
+++ b/src/UserGuide/Master/Basic-Concept/Navigating_Time_Series_Data.md
@@ -0,0 +1,64 @@
+<!--
+
+ Licensed to the Apache Software Foundation (ASF) under one
+ or more contributor license agreements. See the NOTICE file
+ distributed with this work for additional information
+ regarding copyright ownership. The ASF licenses this file
+ to you under the Apache License, Version 2.0 (the
+ "License"); you may not use this file except in compliance
+ with the License. You may obtain a copy of the License at
+
+ http://www.apache.org/licenses/LICENSE-2.0
+
+ Unless required by applicable law or agreed to in writing,
+ software distributed under the License is distributed on an
+ "AS IS" BASIS, WITHOUT WARRANTIES OR CONDITIONS OF ANY
+ KIND, either express or implied. See the License for the
+ specific language governing permissions and limitations
+ under the License.
+
+-->
+# Entering Time Series Data
+
+## What Is Time Series Data?
+
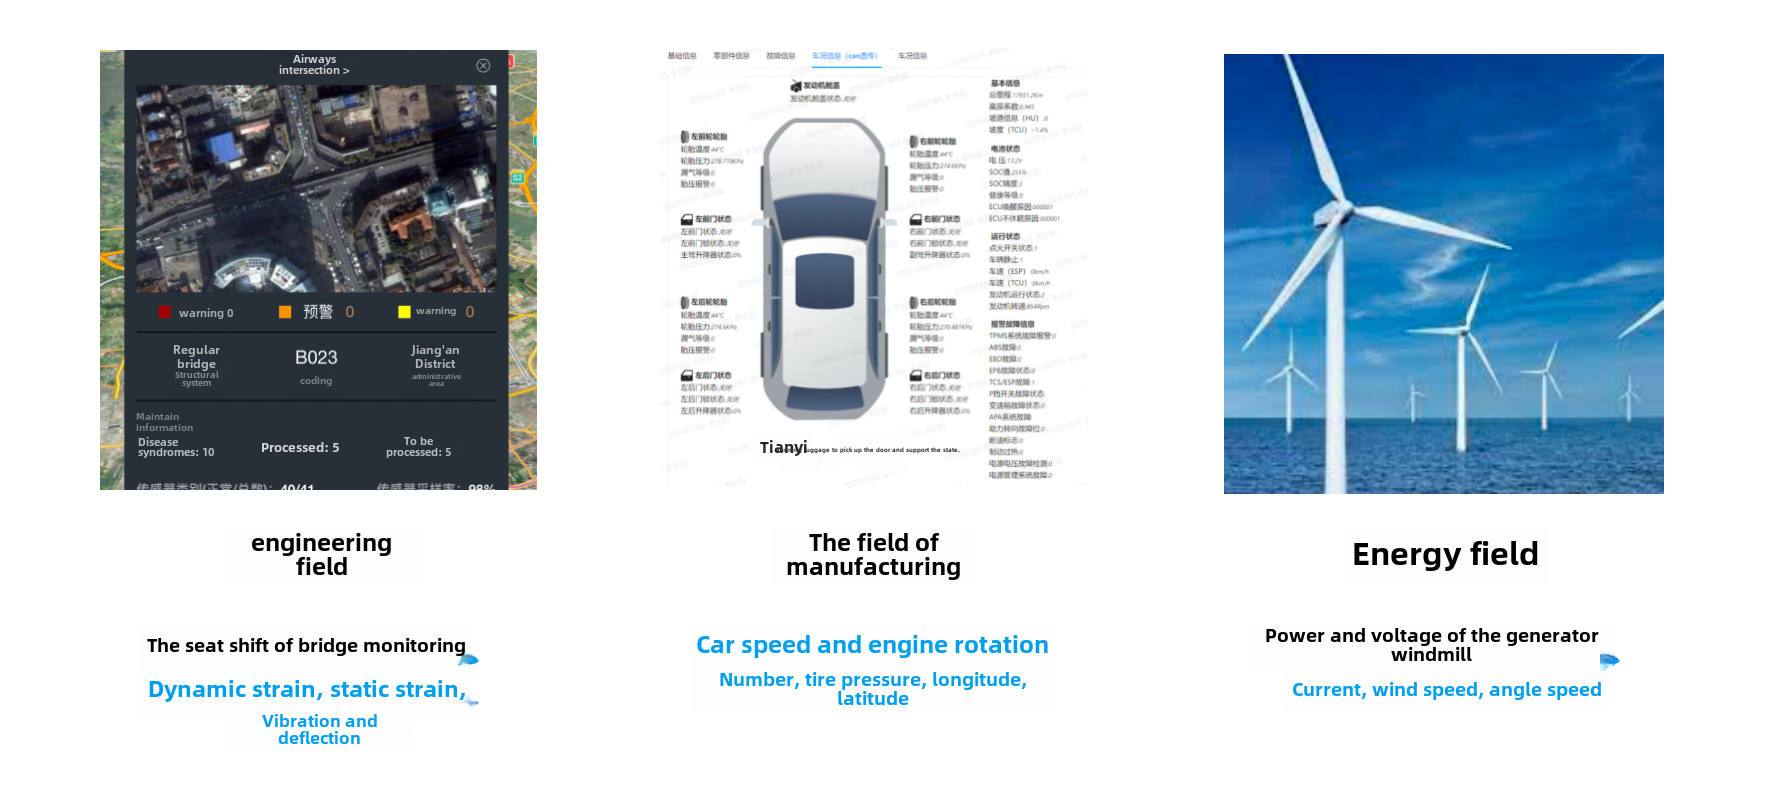
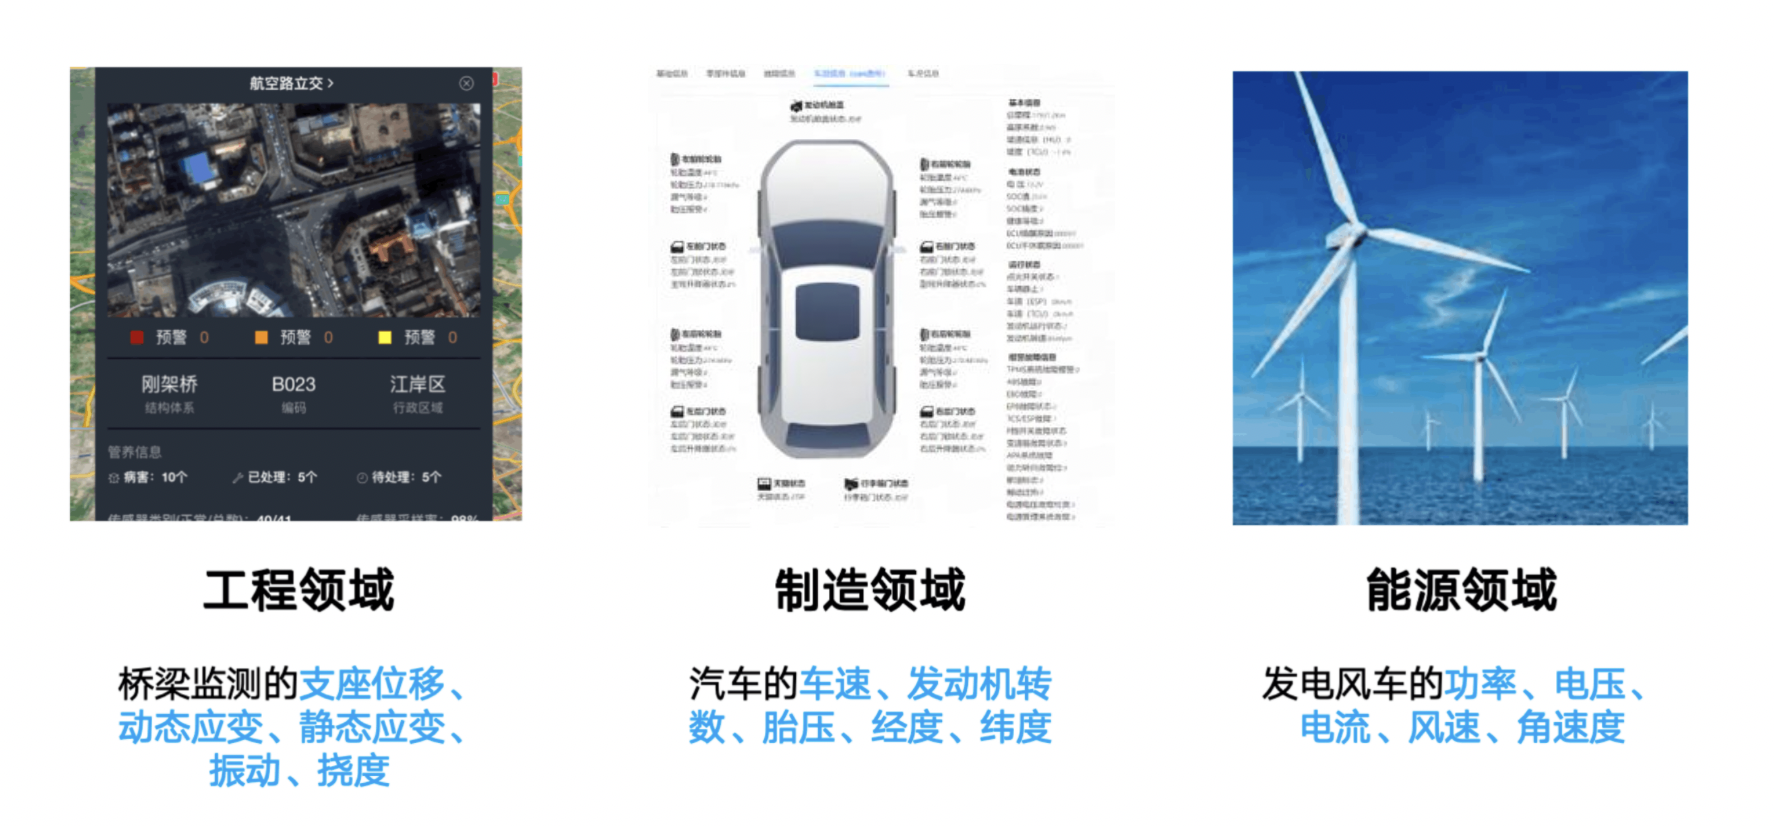
+In today's era of the Internet of Things, various scenarios such as the
Internet of Things and industrial scenarios are undergoing digital
transformation. People collect various states of devices by installing sensors
on them. If the motor collects voltage and current, the blade speed, angular
velocity, and power generation of the fan; Vehicle collection of latitude and
longitude, speed, and fuel consumption; The vibration frequency, deflection,
displacement, etc. of the bridge. The data [...]
+
+
+
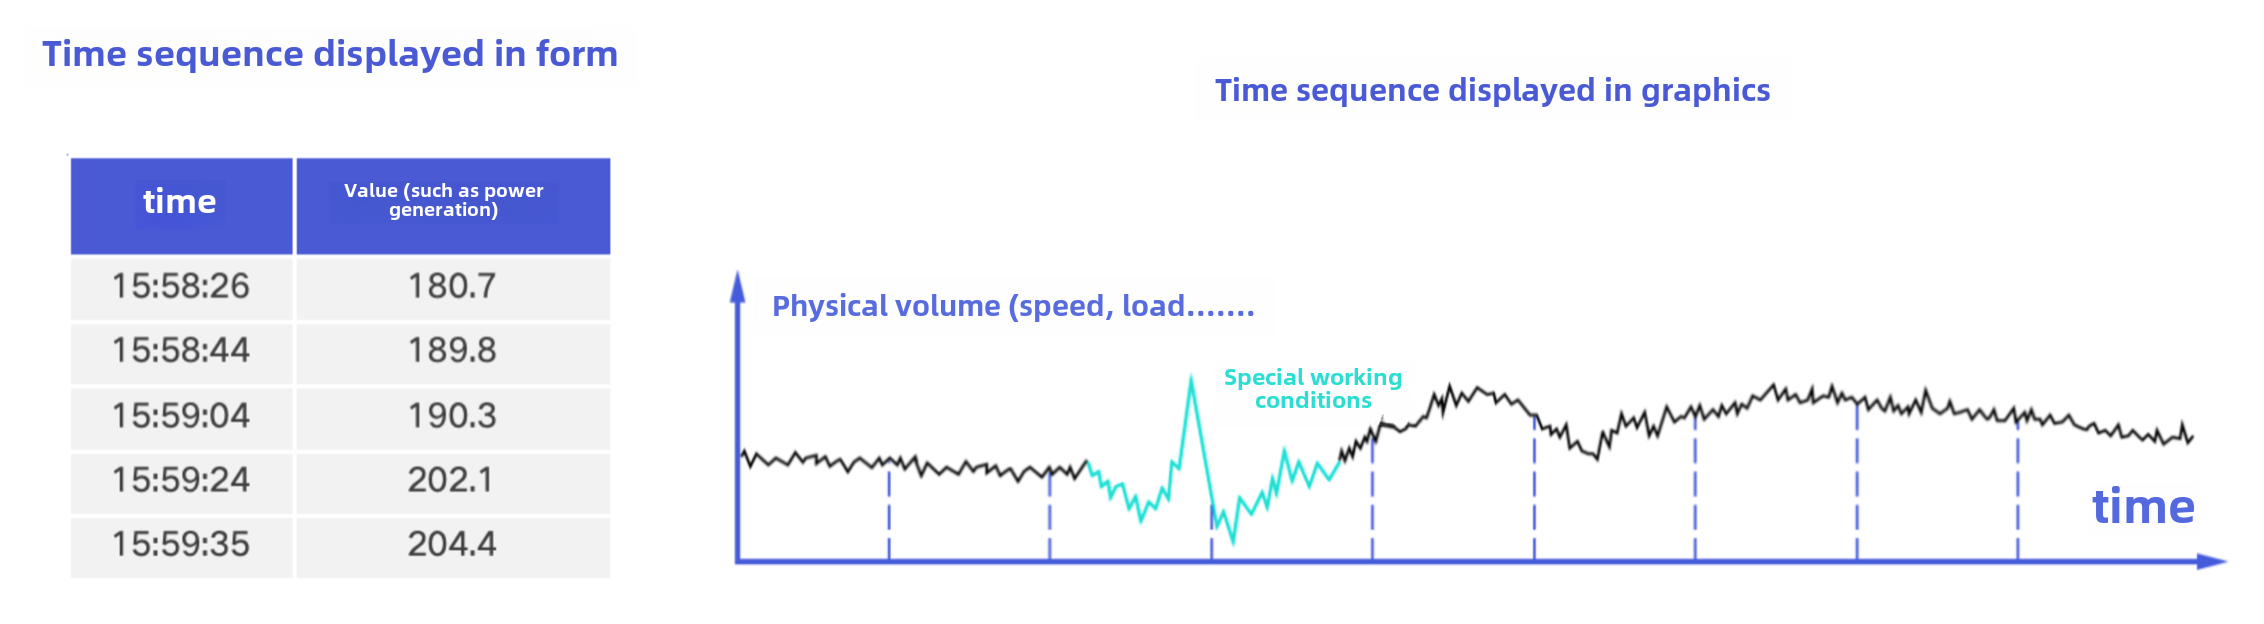
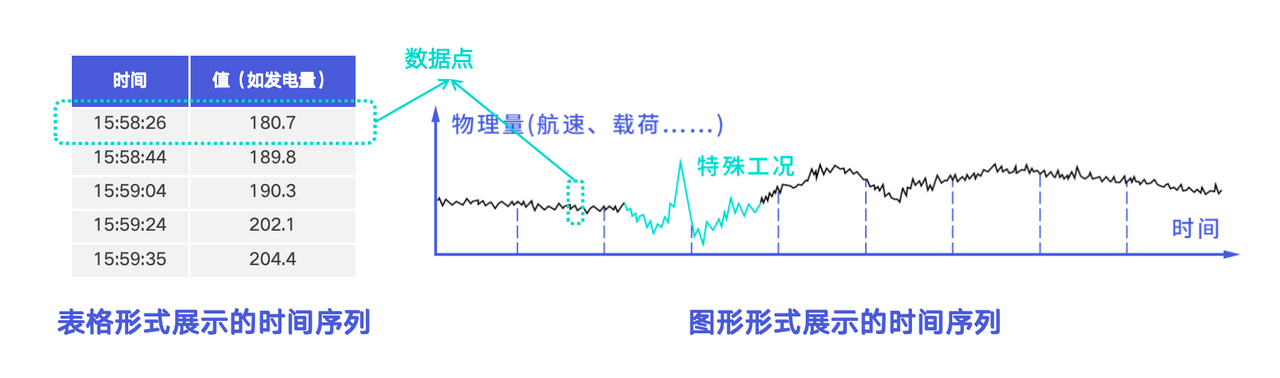
+Generally speaking, we refer to each collection point as a measurement point
(also known as a physical quantity, time series, timeline, signal quantity,
indicator, measurement value, etc.). Each measurement point continuously
collects new data information over time, forming a time series. In the form of
a table, each time series is a table formed by two columns: time and value; In
a graphical way, each time series is a trend chart formed over time, which can
also be vividly referred to a [...]
+
+
+
+The massive time series data generated by sensors is the foundation of digital
transformation in various industries, so our modeling of time series data
mainly focuses on equipment and sensors.
+
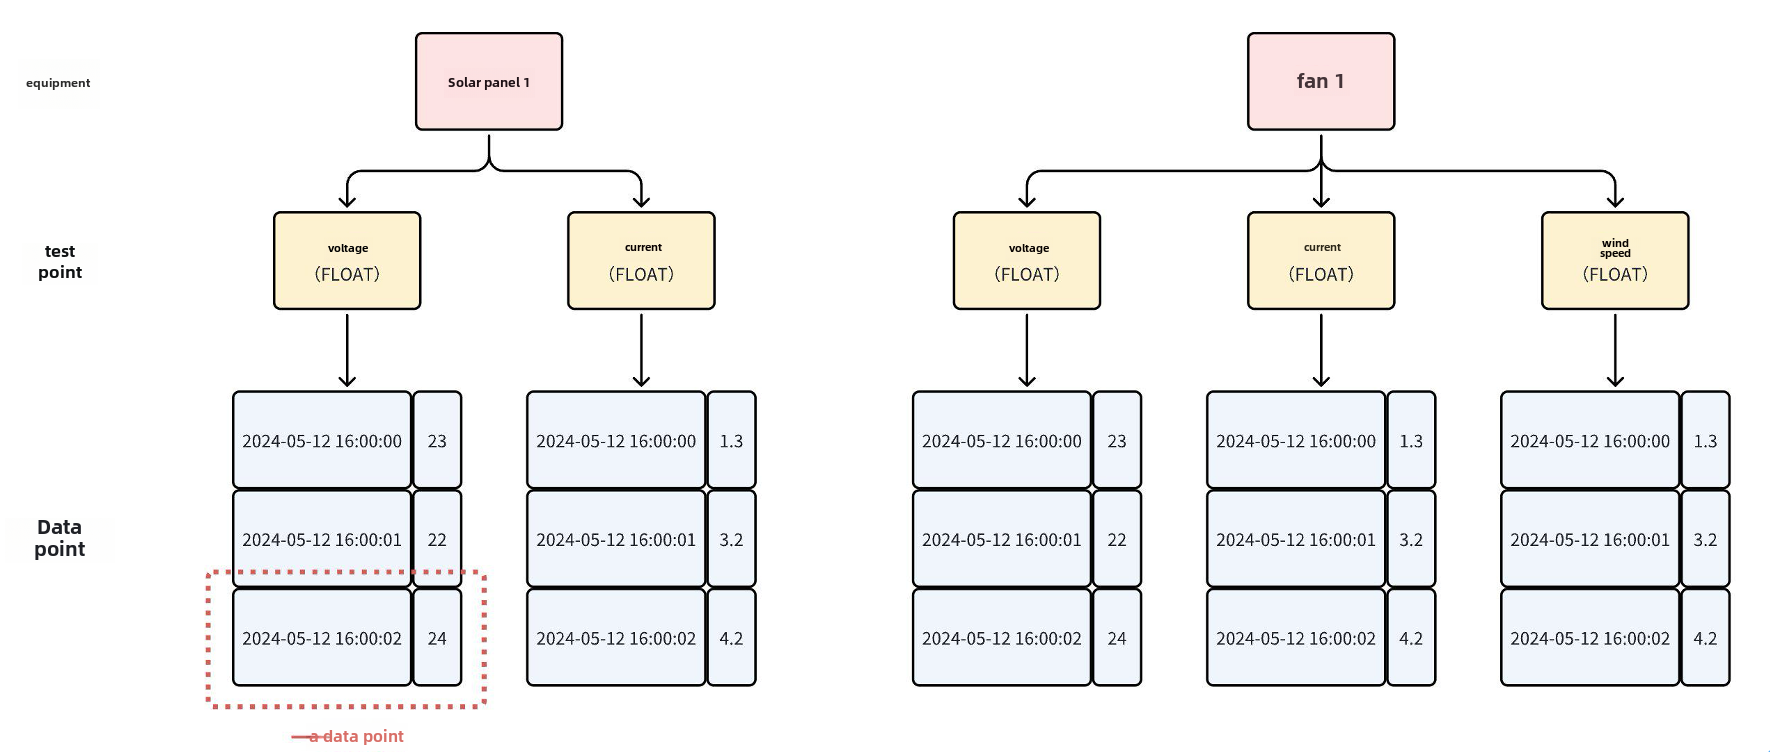
+## Key Concepts of Time Series Data
+The main concepts involved in time-series data can be divided from bottom to
top: data points, measurement points, and equipment.
+
+
+
+### Data Point
+
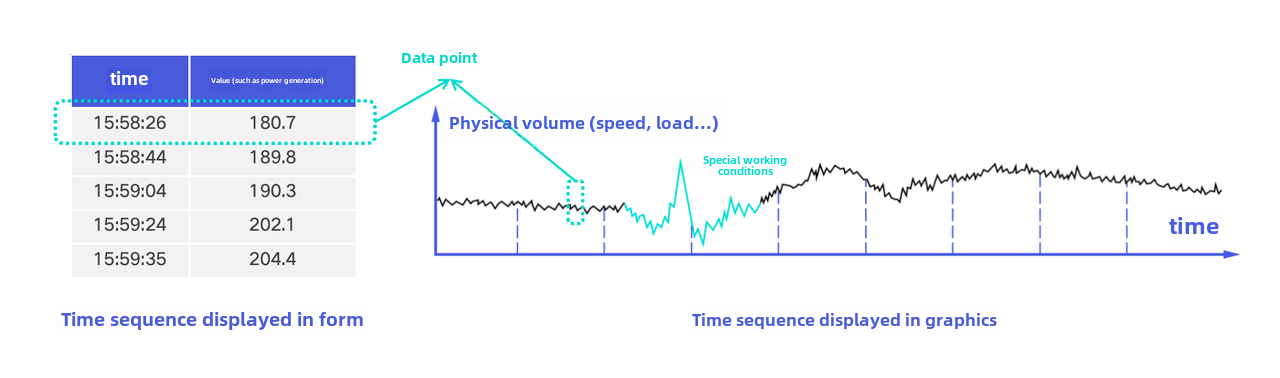
+- Definition: Consists of a timestamp and a value, where the timestamp is of
type long and the value can be of various types such as BOOLEAN, FLOAT, INT32,
etc.
+- Example: A row of a time series in the form of a table in the above figure,
or a point of a time series in the form of a graph, is a data point.
+
+
+
+### Measurement Points
+
+- Definition: It is a time series formed by multiple data points arranged in
increments according to timestamps. Usually, a measuring point represents a
collection point and can regularly collect physical quantities of the
environment it is located in.
+- Also known as: physical quantity, time series, timeline, semaphore,
indicator, measurement value, etc
+- Example:
+ - Electricity scenario: current, voltage
+ - Energy scenario: wind speed, rotational speed
+ - Vehicle networking scenarios: fuel consumption, vehicle speed, longitude,
dimensions
+ - Factory scenario: temperature, humidity
+
+### Device
+
+- Definition: Corresponding to a physical device in an actual scene, usually a
collection of measurement points, identified by one to multiple labels
+- Example:
+ - Vehicle networking scenario: Vehicles identified by vehicle identification
code (VIN)
+ - Factory scenario: robotic arm, unique ID identification generated by IoT
platform
+ - Energy scenario: Wind turbines, identified by region, station, line,
model, instance, etc
+ - Monitoring scenario: CPU, identified by machine room, rack, Hostname,
device type, etc
\ No newline at end of file
diff --git a/src/UserGuide/latest/Basic-Concept/Navigating_Time_Series_Data.md
b/src/UserGuide/latest/Basic-Concept/Navigating_Time_Series_Data.md
new file mode 100644
index 0000000..61dc07b
--- /dev/null
+++ b/src/UserGuide/latest/Basic-Concept/Navigating_Time_Series_Data.md
@@ -0,0 +1,65 @@
+<!--
+
+ Licensed to the Apache Software Foundation (ASF) under one
+ or more contributor license agreements. See the NOTICE file
+ distributed with this work for additional information
+ regarding copyright ownership. The ASF licenses this file
+ to you under the Apache License, Version 2.0 (the
+ "License"); you may not use this file except in compliance
+ with the License. You may obtain a copy of the License at
+
+ http://www.apache.org/licenses/LICENSE-2.0
+
+ Unless required by applicable law or agreed to in writing,
+ software distributed under the License is distributed on an
+ "AS IS" BASIS, WITHOUT WARRANTIES OR CONDITIONS OF ANY
+ KIND, either express or implied. See the License for the
+ specific language governing permissions and limitations
+ under the License.
+
+-->
+# Navigating Time Series Data
+
+## What Is Time Series Data?
+
+In today's era of the Internet of Things, various scenarios such as the
Internet of Things and industrial scenarios are undergoing digital
transformation. People collect various states of devices by installing sensors
on them. If the motor collects voltage and current, the blade speed, angular
velocity, and power generation of the fan; Vehicle collection of latitude and
longitude, speed, and fuel consumption; The vibration frequency, deflection,
displacement, etc. of the bridge. The data [...]
+
+
+
+Generally speaking, we refer to each collection point as a measurement point
(also known as a physical quantity, time series, timeline, signal quantity,
indicator, measurement value, etc.). Each measurement point continuously
collects new data information over time, forming a time series. In the form of
a table, each time series is a table formed by two columns: time and value; In
a graphical way, each time series is a trend chart formed over time, which can
also be vividly referred to a [...]
+
+
+
+The massive time series data generated by sensors is the foundation of digital
transformation in various industries, so our modeling of time series data
mainly focuses on equipment and sensors.
+
+## Key Concepts of Time Series Data
+
+The main concepts involved in time-series data can be divided from bottom to
top: data points, measurement points, and equipment.
+
+
+
+### Data Point
+
+- Definition: Consists of a timestamp and a value, where the timestamp is of
type long and the value can be of various types such as BOOLEAN, FLOAT, INT32,
etc.
+- Example: A row of a time series in the form of a table in the above figure,
or a point of a time series in the form of a graph, is a data point.
+
+
+
+### Measurement Points
+
+- Definition: It is a time series formed by multiple data points arranged in
increments according to timestamps. Usually, a measuring point represents a
collection point and can regularly collect physical quantities of the
environment it is located in.
+- Also known as: physical quantity, time series, timeline, semaphore,
indicator, measurement value, etc
+- Example:
+ - Electricity scenario: current, voltage
+ - Energy scenario: wind speed, rotational speed
+ - Vehicle networking scenarios: fuel consumption, vehicle speed, longitude,
dimensions
+ - Factory scenario: temperature, humidity
+
+### Device
+
+- Definition: Corresponding to a physical device in an actual scene, usually a
collection of measurement points, identified by one to multiple labels
+- Example:
+ - Vehicle networking scenario: Vehicles identified by vehicle identification
code (VIN)
+ - Factory scenario: robotic arm, unique ID identification generated by IoT
platform
+ - Energy scenario: Wind turbines, identified by region, station, line,
model, instance, etc
+ - Monitoring scenario: CPU, identified by machine room, rack, Hostname,
device type, etc
\ No newline at end of file
diff --git
a/src/zh/UserGuide/Master/Basic-Concept/Navigating_Time_Series_Data.md
b/src/zh/UserGuide/Master/Basic-Concept/Navigating_Time_Series_Data.md
new file mode 100644
index 0000000..96e9fdf
--- /dev/null
+++ b/src/zh/UserGuide/Master/Basic-Concept/Navigating_Time_Series_Data.md
@@ -0,0 +1,67 @@
+<!--
+
+ Licensed to the Apache Software Foundation (ASF) under one
+ or more contributor license agreements. See the NOTICE file
+ distributed with this work for additional information
+ regarding copyright ownership. The ASF licenses this file
+ to you under the Apache License, Version 2.0 (the
+ "License"); you may not use this file except in compliance
+ with the License. You may obtain a copy of the License at
+
+ http://www.apache.org/licenses/LICENSE-2.0
+
+ Unless required by applicable law or agreed to in writing,
+ software distributed under the License is distributed on an
+ "AS IS" BASIS, WITHOUT WARRANTIES OR CONDITIONS OF ANY
+ KIND, either express or implied. See the License for the
+ specific language governing permissions and limitations
+ under the License.
+
+-->
+# 走进时序数据
+
+## 什么叫时序数据?
+
+万物互联的今天,物联网场景、工业场景等各类场景都在进行数字化转型,人们通过在各类设备上安装传感器对设备的各类状态进行采集。如电机采集电压、电流,风机的叶片转速、角速度、发电功率;车辆采集经纬度、速度、油耗;桥梁的振动频率、挠度、位移量等。传感器的数据采集,已经渗透在各个行业中。
+
+
+
+
+
+通常来说,我们把每个采集点位叫做一个**测点(
也叫物理量、时间序列、时间线、信号量、指标、测量值等)**,每个测点都在随时间的推移不断收集到新的数据信息,从而构成了一条**时间序列**。用表格的方式,每个时间序列就是一个由时间、值两列形成的表格;用图形化的方式,每个时间序列就是一个随时间推移形成的走势图,也可以形象的称之为设备的“心电图”。
+
+
+
+传感器产生的海量时序数据是各行各业数字化转型的基础,因此我们对时序数据的模型梳理主要围绕设备、传感器展开。
+
+## 时序数据中的关键概念有哪些?
+
+时序数据中主要涉及的概念由下至上可分为:数据点、测点、设备。
+
+
+
+### 数据点
+
+- 定义:由一个时间戳和一个数值组成,其中时间戳为 long 类型,数值可以为 BOOLEAN、FLOAT、INT32 等各种类型。
+- 示例:如上图中表格形式的时间序列的一行,或图形形式的时间序列的一个点,就是一个数据点。
+
+
+
+### 测点
+
+- 定义:是多个数据点按时间戳递增排列形成的一个时间序列。通常一个测点代表一个采集点位,能够定期采集所在环境的物理量。
+- 又名:物理量、时间序列、时间线、信号量、指标、测量值等
+- 示例:
+ - 电力场景:电流、电压
+ - 能源场景:风速、转速
+ - 车联网场景:油量、车速、经度、维度
+ - 工厂场景:温度、湿度
+
+### 设备
+
+- 定义:对应一个实际场景中的物理设备,通常是一组测点的集合,由一到多个标签定位标识
+- 示例
+ - 车联网场景:车辆,由车辆识别代码 VIN 标识
+ - 工厂场景:机械臂,由物联网平台生成的唯一 ID 标识
+ - 能源场景:风机,由区域、场站、线路、机型、实例等标识
+ - 监控场景:CPU,由机房、机架、Hostname、设备类型等标识
\ No newline at end of file
diff --git
a/src/zh/UserGuide/latest/Basic-Concept/Navigating_Time_Series_Data.md
b/src/zh/UserGuide/latest/Basic-Concept/Navigating_Time_Series_Data.md
new file mode 100644
index 0000000..96e9fdf
--- /dev/null
+++ b/src/zh/UserGuide/latest/Basic-Concept/Navigating_Time_Series_Data.md
@@ -0,0 +1,67 @@
+<!--
+
+ Licensed to the Apache Software Foundation (ASF) under one
+ or more contributor license agreements. See the NOTICE file
+ distributed with this work for additional information
+ regarding copyright ownership. The ASF licenses this file
+ to you under the Apache License, Version 2.0 (the
+ "License"); you may not use this file except in compliance
+ with the License. You may obtain a copy of the License at
+
+ http://www.apache.org/licenses/LICENSE-2.0
+
+ Unless required by applicable law or agreed to in writing,
+ software distributed under the License is distributed on an
+ "AS IS" BASIS, WITHOUT WARRANTIES OR CONDITIONS OF ANY
+ KIND, either express or implied. See the License for the
+ specific language governing permissions and limitations
+ under the License.
+
+-->
+# 走进时序数据
+
+## 什么叫时序数据?
+
+万物互联的今天,物联网场景、工业场景等各类场景都在进行数字化转型,人们通过在各类设备上安装传感器对设备的各类状态进行采集。如电机采集电压、电流,风机的叶片转速、角速度、发电功率;车辆采集经纬度、速度、油耗;桥梁的振动频率、挠度、位移量等。传感器的数据采集,已经渗透在各个行业中。
+
+
+
+
+
+通常来说,我们把每个采集点位叫做一个**测点(
也叫物理量、时间序列、时间线、信号量、指标、测量值等)**,每个测点都在随时间的推移不断收集到新的数据信息,从而构成了一条**时间序列**。用表格的方式,每个时间序列就是一个由时间、值两列形成的表格;用图形化的方式,每个时间序列就是一个随时间推移形成的走势图,也可以形象的称之为设备的“心电图”。
+
+
+
+传感器产生的海量时序数据是各行各业数字化转型的基础,因此我们对时序数据的模型梳理主要围绕设备、传感器展开。
+
+## 时序数据中的关键概念有哪些?
+
+时序数据中主要涉及的概念由下至上可分为:数据点、测点、设备。
+
+
+
+### 数据点
+
+- 定义:由一个时间戳和一个数值组成,其中时间戳为 long 类型,数值可以为 BOOLEAN、FLOAT、INT32 等各种类型。
+- 示例:如上图中表格形式的时间序列的一行,或图形形式的时间序列的一个点,就是一个数据点。
+
+
+
+### 测点
+
+- 定义:是多个数据点按时间戳递增排列形成的一个时间序列。通常一个测点代表一个采集点位,能够定期采集所在环境的物理量。
+- 又名:物理量、时间序列、时间线、信号量、指标、测量值等
+- 示例:
+ - 电力场景:电流、电压
+ - 能源场景:风速、转速
+ - 车联网场景:油量、车速、经度、维度
+ - 工厂场景:温度、湿度
+
+### 设备
+
+- 定义:对应一个实际场景中的物理设备,通常是一组测点的集合,由一到多个标签定位标识
+- 示例
+ - 车联网场景:车辆,由车辆识别代码 VIN 标识
+ - 工厂场景:机械臂,由物联网平台生成的唯一 ID 标识
+ - 能源场景:风机,由区域、场站、线路、机型、实例等标识
+ - 监控场景:CPU,由机房、机架、Hostname、设备类型等标识
\ No newline at end of file