This is an automated email from the ASF dual-hosted git repository.

qiaojialin pushed a commit to branch main
in repository https://gitbox.apache.org/repos/asf/iotdb-docs.git
The following commit(s) were added to refs/heads/main by this push:
new f752406 Fix image format (#259)
f752406 is described below
commit f752406cf175f6ac436e1efdd1104c1e559c7cd7
Author: majialin <[email protected]>
AuthorDate: Fri Jun 28 16:44:12 2024 +0800
Fix image format (#259)
---
.../Deployment-and-Maintenance/Monitoring-panel-deployment.md | 6 +++++-
.../Deployment-and-Maintenance/Monitoring-panel-deployment.md | 6 +++++-
.../Deployment-and-Maintenance/Monitoring-panel-deployment.md | 6 +++++-
.../Deployment-and-Maintenance/Monitoring-panel-deployment.md | 6 +++++-
4 files changed, 20 insertions(+), 4 deletions(-)
diff --git
a/src/UserGuide/Master/Deployment-and-Maintenance/Monitoring-panel-deployment.md
b/src/UserGuide/Master/Deployment-and-Maintenance/Monitoring-panel-deployment.md
index bcf3585..4cbfdcf 100644
---
a/src/UserGuide/Master/Deployment-and-Maintenance/Monitoring-panel-deployment.md
+++
b/src/UserGuide/Master/Deployment-and-Maintenance/Monitoring-panel-deployment.md
@@ -170,7 +170,11 @@ When configuring the Data Source, pay attention to the URL
where Prometheus is l
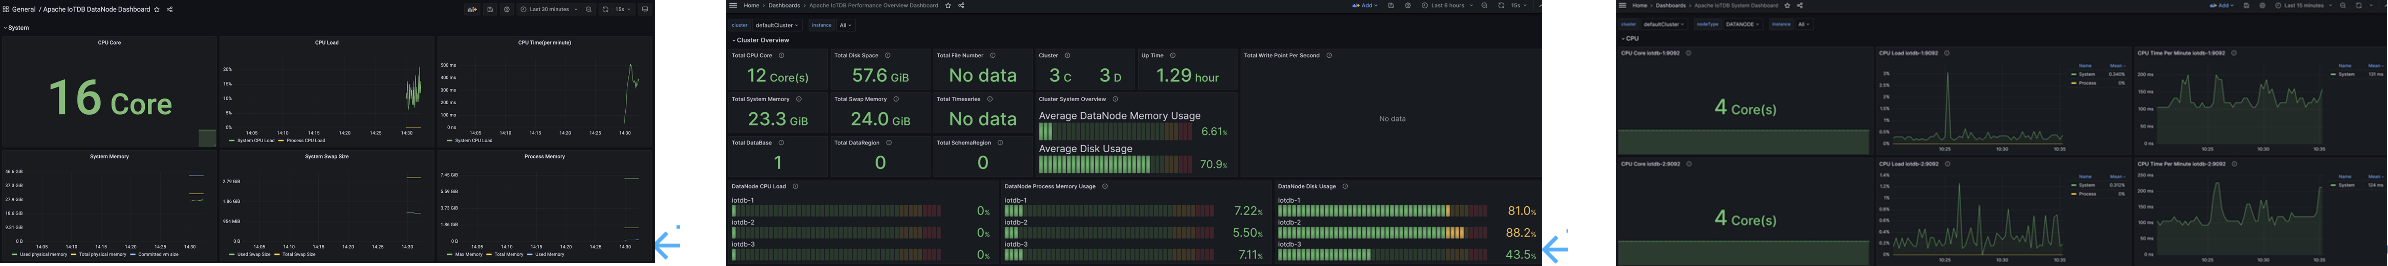
7. Similarly, we can import the Apache IoTDB DataNode Dashboard Apache
Performance Overview Dashboard、Apache System Overview Dashboard, You can see
the following monitoring panel:
- 
+ <div style="display: flex;justify-content: space-between;">
+ <img
src="https://alioss.timecho.com/docs/img/%E9%9D%A2%E6%9D%BF1-eppf.png"; alt=""
style="width: 30%;" />
+ <img src="https://alioss.timecho.com/docs/img/%E9%9D%A2%E6%9D%BF2.png";
alt="" style="width: 30%;"/>
+ <img src="https://alioss.timecho.com/docs/img/%E9%9D%A2%E6%9D%BF3.png";
alt="" style="width: 30%;"/>
+ </div>
8. At this point, all IoTDB monitoring panels have been imported and
monitoring information can now be viewed at any time.
diff --git
a/src/UserGuide/latest/Deployment-and-Maintenance/Monitoring-panel-deployment.md
b/src/UserGuide/latest/Deployment-and-Maintenance/Monitoring-panel-deployment.md
index bcf3585..94388a2 100644
---
a/src/UserGuide/latest/Deployment-and-Maintenance/Monitoring-panel-deployment.md
+++
b/src/UserGuide/latest/Deployment-and-Maintenance/Monitoring-panel-deployment.md
@@ -170,7 +170,11 @@ When configuring the Data Source, pay attention to the URL
where Prometheus is l
7. Similarly, we can import the Apache IoTDB DataNode Dashboard Apache
Performance Overview Dashboard、Apache System Overview Dashboard, You can see
the following monitoring panel:
- 
+ <div style="display: flex;justify-content: space-between;">
+ <img
src="https://alioss.timecho.com/docs/img/%E9%9D%A2%E6%9D%BF1-eppf.png"; alt=""
style="width: 30%;" />
+ <img src="https://alioss.timecho.com/docs/img/%E9%9D%A2%E6%9D%BF2.png";
alt="" style="width: 30%;"/>
+ <img src="https://alioss.timecho.com/docs/img/%E9%9D%A2%E6%9D%BF3.png";
alt="" style="width: 30%;"/>
+ </div>
8. At this point, all IoTDB monitoring panels have been imported and
monitoring information can now be viewed at any time.
diff --git
a/src/zh/UserGuide/Master/Deployment-and-Maintenance/Monitoring-panel-deployment.md
b/src/zh/UserGuide/Master/Deployment-and-Maintenance/Monitoring-panel-deployment.md
index 5ffce59..4e59cc2 100644
---
a/src/zh/UserGuide/Master/Deployment-and-Maintenance/Monitoring-panel-deployment.md
+++
b/src/zh/UserGuide/Master/Deployment-and-Maintenance/Monitoring-panel-deployment.md
@@ -172,7 +172,11 @@ cd grafana-*
7. 同样地,我们可以导入Apache IoTDB DataNode Dashboard、Apache Performance Overview
Dashboard、Apache System Overview Dashboard,可看到如下的监控面板:
- 
+ <div style="display: flex;justify-content: space-between;">
+ <img
src="https://alioss.timecho.com/docs/img/%E9%9D%A2%E6%9D%BF1-eppf.png"; alt=""
style="width: 30%;" />
+ <img src="https://alioss.timecho.com/docs/img/%E9%9D%A2%E6%9D%BF2.png";
alt="" style="width: 30%;"/>
+ <img src="https://alioss.timecho.com/docs/img/%E9%9D%A2%E6%9D%BF3.png";
alt="" style="width: 30%;"/>
+ </div>
8. 至此,IoTDB监控面板就全部导入完成了,现在可以随时查看监控信息了。
diff --git
a/src/zh/UserGuide/latest/Deployment-and-Maintenance/Monitoring-panel-deployment.md
b/src/zh/UserGuide/latest/Deployment-and-Maintenance/Monitoring-panel-deployment.md
index 5ffce59..4e59cc2 100644
---
a/src/zh/UserGuide/latest/Deployment-and-Maintenance/Monitoring-panel-deployment.md
+++
b/src/zh/UserGuide/latest/Deployment-and-Maintenance/Monitoring-panel-deployment.md
@@ -172,7 +172,11 @@ cd grafana-*
7. 同样地,我们可以导入Apache IoTDB DataNode Dashboard、Apache Performance Overview
Dashboard、Apache System Overview Dashboard,可看到如下的监控面板:
- 
+ <div style="display: flex;justify-content: space-between;">
+ <img
src="https://alioss.timecho.com/docs/img/%E9%9D%A2%E6%9D%BF1-eppf.png"; alt=""
style="width: 30%;" />
+ <img src="https://alioss.timecho.com/docs/img/%E9%9D%A2%E6%9D%BF2.png";
alt="" style="width: 30%;"/>
+ <img src="https://alioss.timecho.com/docs/img/%E9%9D%A2%E6%9D%BF3.png";
alt="" style="width: 30%;"/>
+ </div>
8. 至此,IoTDB监控面板就全部导入完成了,现在可以随时查看监控信息了。