This is an automated email from the ASF dual-hosted git repository.

caogaofei pushed a commit to branch main
in repository https://gitbox.apache.org/repos/asf/iotdb-docs.git
The following commit(s) were added to refs/heads/main by this push:
new ddc6fe8 Fix image styles
ddc6fe8 is described below
commit ddc6fe8e5cef0c1dda03895da9cb9b5b017a0c43
Author: majialin <[email protected]>
AuthorDate: Mon Jul 1 10:38:39 2024 +0800
Fix image styles
---
.../Master/Deployment-and-Maintenance/Monitoring-panel-deployment.md | 5 ++++-
.../latest/Deployment-and-Maintenance/Monitoring-panel-deployment.md | 5 ++++-
.../Master/Deployment-and-Maintenance/Monitoring-panel-deployment.md | 5 ++++-
.../latest/Deployment-and-Maintenance/Monitoring-panel-deployment.md | 5 ++++-
4 files changed, 16 insertions(+), 4 deletions(-)
diff --git
a/src/UserGuide/Master/Deployment-and-Maintenance/Monitoring-panel-deployment.md
b/src/UserGuide/Master/Deployment-and-Maintenance/Monitoring-panel-deployment.md
index 4cbfdcf..8d2a917 100644
---
a/src/UserGuide/Master/Deployment-and-Maintenance/Monitoring-panel-deployment.md
+++
b/src/UserGuide/Master/Deployment-and-Maintenance/Monitoring-panel-deployment.md
@@ -108,7 +108,10 @@ scrape_configs:
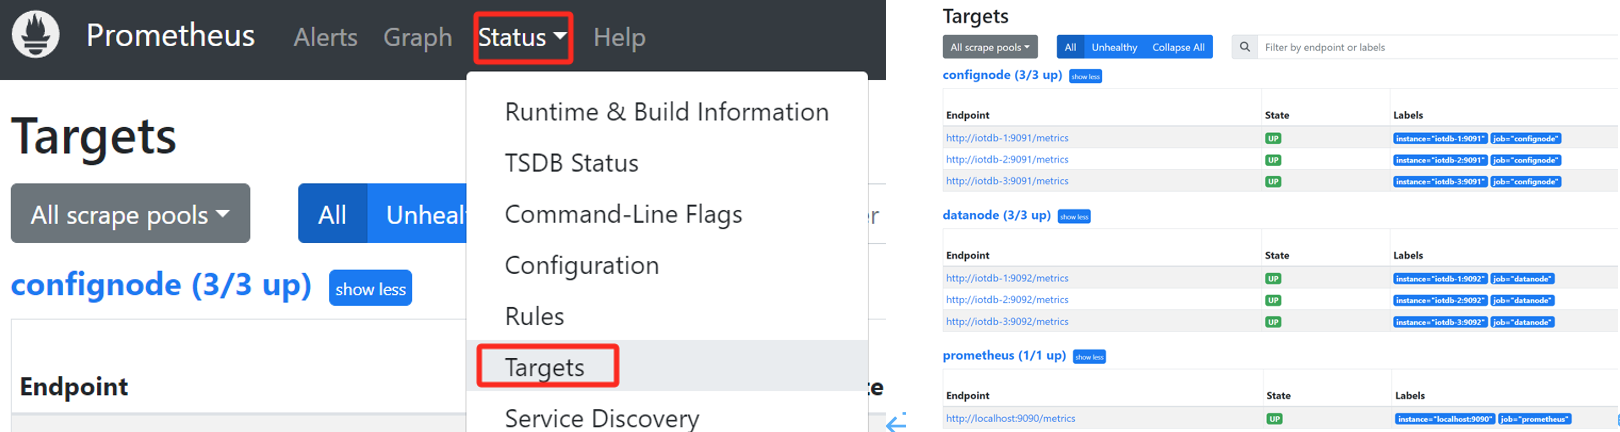
5. Confirm successful startup. Enter in browser http://192.168.1.3:9090 Go to
Prometheus and click on the Target interface under Status. When you see that
all States are Up, it indicates successful configuration and connectivity.
-
+ <div style="display: flex;justify-content: space-between;">
+ <img src="https://alioss.timecho.com/docs/img/%E5%90%AF%E5%8A%A8_1.png";
alt="" style="width: 50%;" />
+ <img src="https://alioss.timecho.com/docs/img/%E5%90%AF%E5%8A%A8_2.png";
alt="" style="width: 48%;"/>
+ </div>
6. Clicking on the left link in Targets will redirect you to web monitoring
and view the monitoring information of the corresponding node:
diff --git
a/src/UserGuide/latest/Deployment-and-Maintenance/Monitoring-panel-deployment.md
b/src/UserGuide/latest/Deployment-and-Maintenance/Monitoring-panel-deployment.md
index 94388a2..03a69fd 100644
---
a/src/UserGuide/latest/Deployment-and-Maintenance/Monitoring-panel-deployment.md
+++
b/src/UserGuide/latest/Deployment-and-Maintenance/Monitoring-panel-deployment.md
@@ -108,7 +108,10 @@ scrape_configs:
5. Confirm successful startup. Enter in browser http://192.168.1.3:9090 Go to
Prometheus and click on the Target interface under Status. When you see that
all States are Up, it indicates successful configuration and connectivity.
-
+ <div style="display: flex;justify-content: space-between;">
+ <img src="https://alioss.timecho.com/docs/img/%E5%90%AF%E5%8A%A8_1.png";
alt="" style="width: 50%;" />
+ <img src="https://alioss.timecho.com/docs/img/%E5%90%AF%E5%8A%A8_2.png";
alt="" style="width: 48%;"/>
+ </div>
6. Clicking on the left link in Targets will redirect you to web monitoring
and view the monitoring information of the corresponding node:
diff --git
a/src/zh/UserGuide/Master/Deployment-and-Maintenance/Monitoring-panel-deployment.md
b/src/zh/UserGuide/Master/Deployment-and-Maintenance/Monitoring-panel-deployment.md
index 4e59cc2..8df703e 100644
---
a/src/zh/UserGuide/Master/Deployment-and-Maintenance/Monitoring-panel-deployment.md
+++
b/src/zh/UserGuide/Master/Deployment-and-Maintenance/Monitoring-panel-deployment.md
@@ -108,7 +108,10 @@ scrape_configs:
5. 确认启动成功。在浏览器中输入
http://192.168.1.3:9090,进入Prometheus,点击进入Status下的Target界面,当看到State均为Up时表示配置成功并已经联通。
-
+ <div style="display: flex;justify-content: space-between;">
+ <img src="https://alioss.timecho.com/docs/img/%E5%90%AF%E5%8A%A8_1.png";
alt="" style="width: 50%;" />
+ <img src="https://alioss.timecho.com/docs/img/%E5%90%AF%E5%8A%A8_2.png";
alt="" style="width: 50%;"/>
+ </div>
diff --git
a/src/zh/UserGuide/latest/Deployment-and-Maintenance/Monitoring-panel-deployment.md
b/src/zh/UserGuide/latest/Deployment-and-Maintenance/Monitoring-panel-deployment.md
index 4e59cc2..a1dfb1e 100644
---
a/src/zh/UserGuide/latest/Deployment-and-Maintenance/Monitoring-panel-deployment.md
+++
b/src/zh/UserGuide/latest/Deployment-and-Maintenance/Monitoring-panel-deployment.md
@@ -108,7 +108,10 @@ scrape_configs:
5. 确认启动成功。在浏览器中输入
http://192.168.1.3:9090,进入Prometheus,点击进入Status下的Target界面,当看到State均为Up时表示配置成功并已经联通。
-
+ <div style="display: flex;justify-content: space-between;">
+ <img src="https://alioss.timecho.com/docs/img/%E5%90%AF%E5%8A%A8_1.png";
alt="" style="width: 50%;" />
+ <img src="https://alioss.timecho.com/docs/img/%E5%90%AF%E5%8A%A8_2.png";
alt="" style="width: 48%;"/>
+ </div>