This is an automated email from the ASF dual-hosted git repository.

jackietien pushed a commit to branch ty/ExplainAnalye
in repository https://gitbox.apache.org/repos/asf/iotdb-docs.git
commit 0e950322e80c4f345da8b167a1eebe90cd90451f Author: JackieTien97 <[email protected]> AuthorDate: Wed Aug 14 15:04:38 2024 +0800 Add study case and common issues for explain analyze --- src/UserGuide/Master/User-Manual/Maintennance.md | 209 ++++++++++++++++----- src/UserGuide/latest/User-Manual/Maintennance.md | 208 +++++++++++++++----- .../UserGuide/Master/User-Manual/Maintennance.md | 187 +++++++++++++----- .../UserGuide/latest/User-Manual/Maintennance.md | 187 +++++++++++++----- 4 files changed, 595 insertions(+), 196 deletions(-) diff --git a/src/UserGuide/Master/User-Manual/Maintennance.md b/src/UserGuide/Master/User-Manual/Maintennance.md index e3347ab..6e32db7 100644 --- a/src/UserGuide/Master/User-Manual/Maintennance.md +++ b/src/UserGuide/Master/User-Manual/Maintennance.md @@ -19,29 +19,53 @@ --> -# Maintennance -## Explain tool -### Overview -The significance of query analysis lies in assisting users to understand the execution mechanism and performance bottlenecks of queries, thereby achieving query optimization and performance improvement. This concerns not only the efficiency of query execution but also directly affects the user experience of applications and the effective use of resources. To conduct effective query analysis, IoTDB provides query analysis tools: Explain and Explain Analyze. +# Operation Statements -The Explain tool allows users to preview the execution plan of a query SQL, including how IoTDB organizes data retrieval and processing. +## Explain/Explain Analyze Statements -Explain Analyze goes further by adding performance analysis, fully executing the SQL and displaying the time and resources consumed during the execution of the query. It provides detailed information for IoTDB users to deeply understand query details and perform query optimization. -#### Explain -The Explain command allows users to view the execution plan of an SQL query. The execution plan is presented in the form of operators, describing how IoTDB will execute the query. The output of Explain includes information such as data access strategies, whether filter conditions are pushed down, and the distribution of the query plan across different nodes, providing users with a means to visualize the internal logic of the query execution. Its syntax is as follows: +The purpose of query analysis is to assist users in understanding the execution mechanism and performance bottlenecks of queries, thereby facilitating query optimization and performance enhancement. This is crucial not only for the efficiency of query execution but also for the user experience of applications and the efficient utilization of resources. For effective query analysis, IoTDB versions V1.3.2 and above offer the query analysis statements: Explain and Explain Analyze. -```sql +- Explain Statement: The Explain statement allows users to preview the execution plan of a query SQL, including how IoTDB organizes data retrieval and processing. + +- Explain Analyze Statement: The Explain Analyze statement builds upon the Explain statement by incorporating performance analysis, fully executing the SQL, and displaying the time and resource consumption during the query execution process. This provides IoTDB users with detailed information to deeply understand the details of the query and to perform query optimization. Compared to other common IoTDB troubleshooting methods, Explain Analyze imposes no deployment burden and can analyze [...] + +The comparison of various methods is as follows: + +| Method | Installation Difficulty | Business Impact | Functional Scope | +| :------------------ | :----------------------------------------------------------- | :------------------------------------------------ | :----------------------------------------------------------- | +| Explain Analyze Statement | Low. No additional components are needed; it's a built-in SQL statement of IoTDB. | Low. It only affects the single query being analyzed, with no impact on other online loads. | Supports distributed systems, and can track a single SQL statement. | +| Monitoring Panel | Medium. Requires the installation of the IoTDB monitoring panel tool (an enterprise version tool) and the activation of the IoTDB monitoring service. | Medium. The IoTDB monitoring service's recording of metrics will introduce additional latency. | Supports distributed systems, but only analyzes the overall query load and time consumption of the database. | +| Arthas Sampling | Medium. Requires the installation of the Java Arthas tool (Arthas cannot be directly installed in some intranets, and sometimes a restart of the application is needed after installation). | High. CPU sampling may affect the response speed of online business. | Does not support distributed systems and only analyzes the overall query load and time consumption of the database. | + +### Explain Statement + +#### Syntax + +The Explain command enables users to view the execution plan of a SQL query. The execution plan is presented in the form of operators, describing how IoTDB will execute the query. The syntax is as follows, where SELECT_STATEMENT is the SQL statement related to the query: + +```SQL EXPLAIN <SELECT_STATEMENT> ``` -Where SELECT_STATEMENT is the SQL statement related to the query. An example of usage is as follows: -```sql + +The results returned by Explain include information such as data access strategies, whether filter conditions are pushed down, and how the query plan is distributed across different nodes, providing users with a means to visualize the internal execution logic of the query. + +#### Example + +```SQL + +# Insert data + insert into root.explain.data(timestamp, column1, column2) values(1710494762, "hello", "explain") +# Execute explain statement + explain select * from root.explain.data ``` -Execute the SQL and get the following result: -``` + +Executing the above SQL will yield the following results. It is evident that IoTDB uses two SeriesScan nodes to retrieve the data for column1 and column2, and finally connects them through a fullOuterTimeJoin. + +```Plain +-----------------------------------------------------------------------+ | distribution plan| +-----------------------------------------------------------------------+ @@ -58,49 +82,65 @@ Execute the SQL and get the following result: |└─────────────────────────────────┘ └─────────────────────────────────┘| +-----------------------------------------------------------------------+ ``` -It can be seen that IoTDB retrieves the data for column1 and column2 through two separate SeriesScan nodes, and finally connects them using fullOuterTimeJoin. -#### Explain Analyze -Explain Analyze is a performance analysis SQL built into the IoTDB query engine. Unlike Explain, it executes the corresponding query plan and collects execution information. It can be used to track the specific performance distribution of a query, observe resources, and conduct performance tuning and anomaly analysis. -Compared to other analysis methods where can be attached in IoTDB, Explain Analyze does not require deployment effort and can analyze individual SQL statements, allowing for more precise problem identification: +### Explain Analyze Statement + +#### Syntax -|Method|Installation Difficulty|Impact on Business|Supports Distributed System|Analysis of Individual SQL| -|:----|:----|:----|:----|:----| -|Arthas Sampling|Requires downloading and running files on the machine: some internal networks cannot directly install Arthas; and sometimes, it requires restarting the application after installation|CPU sampling may affect the response speed of online business|No|Online businesses usually have various query loads, and the overall monitoring metrics and sampling results can only reflect the overall load and response times of all queries, unable to analyze the response time of individual [...] -|Monitor Tool|Requires enabling monitoring services or deploying Grafana, and open-source users do not have a monitoring dashboard|Recording metrics will bring additional response time|Yes| Same as Arthas| -|Explain Analyze|No installation required, available upon starting IoTDB|Only affects the single query being analyzed, with no impact on other online loads|Yes|Allows for tracking and analysis of individual SQL statements| +Explain Analyze is a performance analysis SQL that comes with the IoTDB query engine. Unlike Explain, it executes the corresponding query plan and collects execution information, which can be used to track the specific performance distribution of a query, for observing resources, performance tuning, and anomaly analysis. The syntax is as follows: -Its syntax is as following: -```sql +```SQL EXPLAIN ANALYZE [VERBOSE] <SELECT_STATEMENT> ``` -In it, SELECT_STATEMENT corresponds to the query statement to be analyzed. By default, in order to simplify the results as much as possible, EXPLAIN ANALYZE will omit some information. Specifying VERBOSE can be used to output this information. + +Where SELECT_STATEMENT corresponds to the query statement that needs to be analyzed; VERBOSE prints detailed analysis results, and when VERBOSE is not filled in, EXPLAIN ANALYZE will omit some information. + +In the EXPLAIN ANALYZE result set, the following information is included: + -The result set of EXPLAIN ANALYZE will include the following information: + -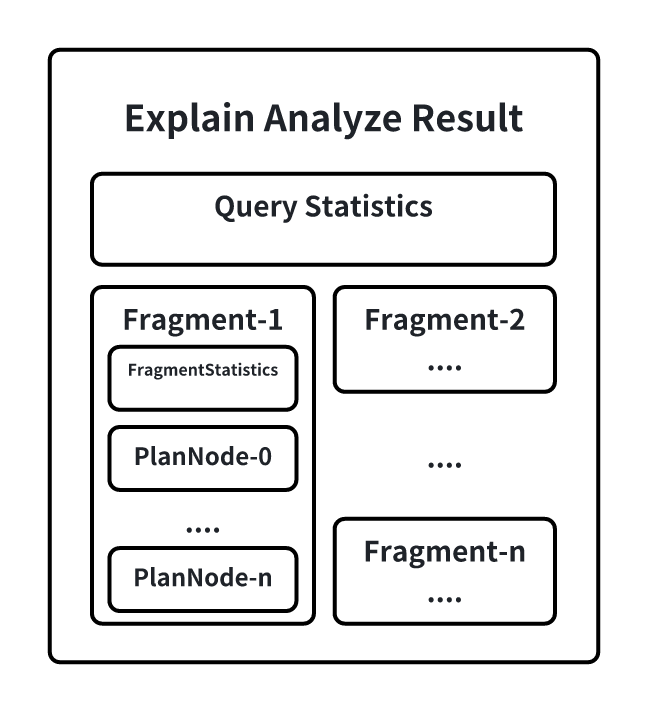 -QueryStatistics contains the statistical information at the query level, primarily including the time consumed during the plan parsing phase, Fragment metadata, and other information. +- QueryStatistics contains statistical information at the query level, mainly including the time spent in the planning and parsing phase, Fragment metadata, and other information. +- FragmentInstance is an encapsulation of the query plan on a node by IoTDB. Each node will output a Fragment information in the result set, mainly including FragmentStatistics and operator information. FragmentStatistics contains statistical information of the Fragment, including total actual time (wall time), TsFile involved, scheduling information, etc. At the same time, the statistical information of the plan nodes under this Fragment will be displayed in a hierarchical way of the no [...] -FragmentInstance is IoTDB's encapsulation of a query plan on a node. Each node will output a Fragment information in the result set, mainly including FragmentStatistics and operator information. +#### Special Instructions -FragmentStatistics includes the statistical information of a Fragment, such as the total actual duration (wall-clock time), the TsFiles involved, scheduling information, etc. The information of a Fragment is also displayed in a tree hierarchy of plan nodes within that Fragment, including: -* CPU runtime -* Number of output rows -* Number of times a specific interface is called -* Memory usage -* Node-specific custom information +1. Simplification of Explain Analyze Statement Results -Below is an example of Explain Analyze: +Since the Fragment will output all the node information executed in the current node, when a query involves too many series, each node is output, which will cause the result set returned by Explain Analyze to be too large. Therefore, when the same type of node exceeds 10, the system will automatically merge all the same types of nodes under the current Fragment, and the merged statistical information is also accumulated. Some custom information that cannot be merged will be directly disc [...] + + + +Users can also modify the configuration item `merge_threshold_of_explain_analyze` in `iotdb-system.properties` to set the threshold for triggering the merge of nodes. This parameter supports hot loading. + +2. Use of Explain Analyze Statement in Query Timeout Scenarios + +Explain Analyze itself is a special query. When the execution times out, it cannot be analyzed with the Explain Analyze statement. In order to be able to investigate the cause of the timeout through the analysis results even when the query times out, Explain Analyze also provides a timing log mechanism (no user configuration is required), which will output the current results of Explain Analyze in the form of text to a special log at a certain time interval. When the query times out, use [...] + +The time interval of the log is calculated based on the query timeout time to ensure that at least two result records will be saved before the timeout. + +#### Example + +Here is an example of Explain Analyze: + +```SQL + +# Insert data -```sql insert into root.explain.analyze.data(timestamp, column1, column2, column3) values(1710494762, "hello", "explain", "analyze") insert into root.explain.analyze.data(timestamp, column1, column2, column3) values(1710494862, "hello2", "explain2", "analyze2") insert into root.explain.analyze.data(timestamp, column1, column2, column3) values(1710494962, "hello3", "explain3", "analyze3") + +# Execute explain analyze statement + explain analyze select column2 from root.explain.analyze.data order by column1 ``` -Get result following: -``` + +The output is as follows: + + +```Plain +-------------------------------------------------------------------------------------------------+ | Explain Analyze| +-------------------------------------------------------------------------------------------------+ @@ -157,16 +197,10 @@ Get result following: | SeriesPath: root.explain.analyze.data.column1 | +-------------------------------------------------------------------------------------------------+ ``` -##### PlanNode Compaction in the Result Of EXPLAIN ANALYZE -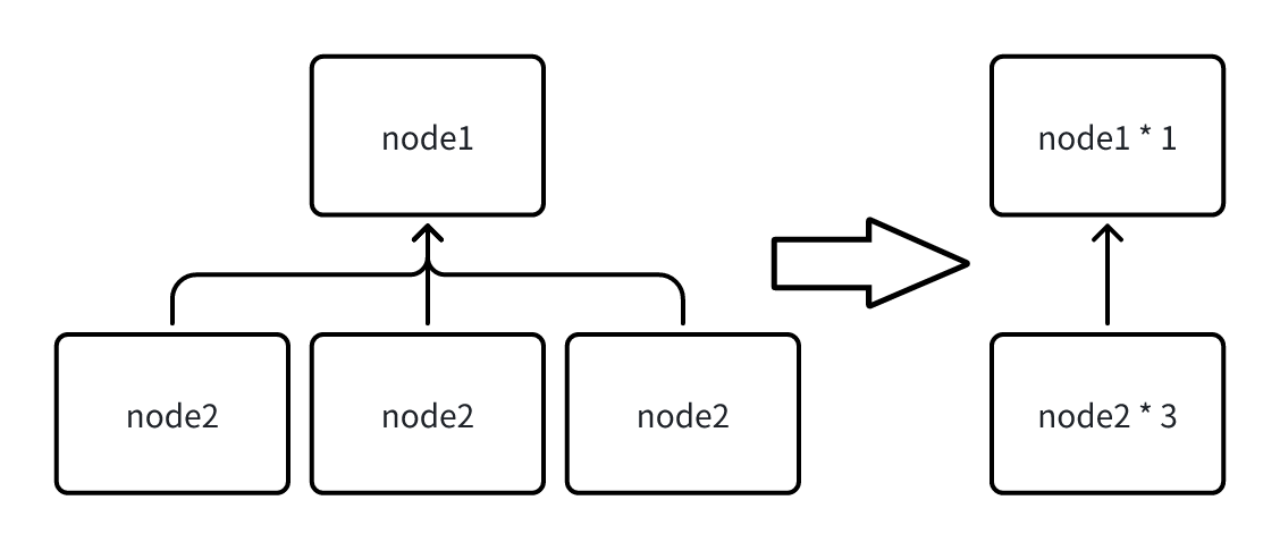 +Example of Partial Results After Triggering Merge: - -In a Fragment, the information of all nodes executed in the current node will be output. However, when a query involves too many series, outputting each seriesScanNode can lead to an excessively large result set from Explain Analyze. Therefore, when the same type of nodes exceeds 10, all nodes of the same type under the current Fragment will be merged. The statistical information is also accumulated after the merge, and some customized information that cannot be merged will be directly d [...] - -The threshold for triggering the merge of nodes can be set by modifying the configuration item `merge_threshold_of_explain_analyze` in iotdb-system.properties, and this parameter supports hot loading. Below is a part of the result example after triggering a merge: - -``` +```Plain Analyze Cost: 143.679 ms Fetch Partition Cost: 22.023 ms Fetch Schema Cost: 63.086 ms @@ -234,7 +268,82 @@ FRAGMENT-INSTANCE[Id: 20240311_041502_00001_1.3.0][IP: 192.168.130.9][DataRegion ``` -##### Query Timeout Handling -Explain Analyze is a unique type of query. When it times out, we are unable to obtain the analysis results from the return. To address this, allowing for the investigation of timeout reasons through analysis results even in cases of timeout, Explain Analyze offers a timed logging mechanism. After certain intervals, the current results of Explain Analyze are output in text form to a dedicated log file. This way, when a query times out, one can go to the logs to investigate the correspondi [...] +### Common Issues + +#### What is the difference between WALL TIME and CPU TIME? + +CPU time, also known as processor time or CPU usage time, refers to the actual time the CPU is occupied with computation during the execution of a program, indicating the actual consumption of processor resources by the program. + +Wall time, also known as real time or physical time, refers to the total time from the start to the end of a program's execution, including all waiting times. + +1. Scenarios where WALL TIME < CPU TIME: For example, a query slice is finally executed in parallel by the scheduler using two threads. In the real physical world, 10 seconds have passed, but the two threads may have occupied two CPU cores and run for 10 seconds each, so the CPU time would be 20 seconds, while the wall time would be 10 seconds. + +2. Scenarios where WALL TIME > CPU TIME: Since there may be multiple queries running in parallel within the system, but the number of execution threads and memory is fixed, + 1. So when a query slice is blocked by some resources (such as not having enough memory for data transfer or waiting for upstream data), it will be put into the Blocked Queue. At this time, the query slice will not occupy CPU time, but the WALL TIME (real physical time) is still advancing. + 2. Or when the query thread resources are insufficient, for example, there are currently 16 query threads in total, but there are 20 concurrent query slices within the system. Even if all queries are not blocked, only 16 query slices can run in parallel at the same time, and the other four will be put into the READY QUEUE, waiting to be scheduled for execution. At this time, the query slice will not occupy CPU time, but the WALL TIME (real physical time) is still advancing. + +#### Is there any additional overhead with Explain Analyze, and is the measured time different from when the query is actually executed? + +Almost none, because the explain analyze operator is executed by a separate thread to collect the statistical information of the original query, and these statistical information, even if not explain analyze, the original query will also generate, but no one goes to get it. And explain analyze is a pure next traversal of the result set, which will not be printed, so there will be no significant difference from the actual execution time of the original query. + +#### What are the main indicators to focus on for IO time consumption? + +The main indicators that may involve IO time consumption are loadTimeSeriesMetadataDiskSeqTime, loadTimeSeriesMetadataDiskUnSeqTime, and construct[NonAligned/Aligned]ChunkReadersDiskTime. + +The loading of TimeSeriesMetadata statistics is divided into sequential and unaligned files, but the reading of Chunks is not temporarily separated, but the proportion of sequential and unaligned can be calculated based on the proportion of TimeSeriesMetadata. + +#### Can the impact of unaligned data on query performance be demonstrated with some indicators? + +There are mainly two impacts of unaligned data: + +1. An additional merge sort needs to be done in memory (it is generally believed that this time consumption is relatively short, after all, it is a pure memory CPU operation) + +2. Unaligned data will generate overlapping time ranges between data blocks, making statistical information unusable + 1. Unable to directly skip the entire chunk that does not meet the value filtering requirements using statistical information + 1. Generally, the user's query only includes time filtering conditions, so there will be no impact + 2. Unable to directly calculate the aggregate value using statistical information without reading the data + +At present, there is no effective observation method for the performance impact of unaligned data alone, unless a query is executed when there is unaligned data, and then executed again after the unaligned data is merged, in order to compare. + +Because even if this part of the unaligned data is entered into the sequence, IO, compression, and decoding are also required. This time cannot be reduced, and it will not be reduced just because the unaligned data has been merged into the unaligned. + +#### Why is there no output in the log_explain_analyze.log when the query times out during the execution of explain analyze? + +During the upgrade, only the lib package was replaced, and the conf/logback-datanode.xml was not replaced. It needs to be replaced, and there is no need to restart (the content of this file can be hot loaded). After waiting for about 1 minute, re-execute explain analyze verbose. + + +### Practical Case Studies + +#### Case Study 1: The query involves too many files, and disk IO becomes a bottleneck, causing the query speed to slow down. + + + +The total query time is 938 ms, of which the time to read the index area and data area from the files accounts for 918 ms, involving a total of 289 files. Assuming the query involves N TsFiles, the theoretical time for the first query (not hitting the cache) is cost = N * (t_seek + t_index + t_seek + t_chunk). Based on experience, the time for a single seek on an HDD disk is about 5-10ms, so the more files involved in the query, the greater the query delay will be. + +The final optimization plan is: + +1. Adjust the merge parameters to reduce the number of files + +2. Replace HDD with SSD to reduce the latency of a single disk IO + + +#### Case Study 2: The execution of the like predicate is slow, causing the query to time out + +When executing the following SQL, the query times out (the default timeout is 60 seconds) + +```SQL +select count(s1) as total from root.db.d1 where s1 like '%XXXXXXXX%' +``` + +When executing explain analyze verbose, even if the query times out, the intermediate collection results will be output to log_explain_analyze.log every 15 seconds. The last two outputs obtained from log_explain_analyze.log are as follows: + + + + + + +Observing the results, we found that it is because the query did not add a time condition, involving too much data, and the time of constructAlignedChunkReadersDiskTime and pageReadersDecodeAlignedDiskTime has been increasing, which means that new chunks are being read all the time. However, the output information of AlignedSeriesScanNode has always been 0, because the operator only gives up the time slice and updates the information when at least one line of data that meets the conditio [...] + +The final optimization plan is: Add a time filtering condition to avoid a full table scan. + -The logging interval is calculated based on the query's timeout setting, ensuring that there are at least two records of results in case of a timeout. \ No newline at end of file diff --git a/src/UserGuide/latest/User-Manual/Maintennance.md b/src/UserGuide/latest/User-Manual/Maintennance.md index e3347ab..22d97b9 100644 --- a/src/UserGuide/latest/User-Manual/Maintennance.md +++ b/src/UserGuide/latest/User-Manual/Maintennance.md @@ -19,29 +19,54 @@ --> -# Maintennance -## Explain tool -### Overview -The significance of query analysis lies in assisting users to understand the execution mechanism and performance bottlenecks of queries, thereby achieving query optimization and performance improvement. This concerns not only the efficiency of query execution but also directly affects the user experience of applications and the effective use of resources. To conduct effective query analysis, IoTDB provides query analysis tools: Explain and Explain Analyze. -The Explain tool allows users to preview the execution plan of a query SQL, including how IoTDB organizes data retrieval and processing. +# Operation Statements -Explain Analyze goes further by adding performance analysis, fully executing the SQL and displaying the time and resources consumed during the execution of the query. It provides detailed information for IoTDB users to deeply understand query details and perform query optimization. -#### Explain -The Explain command allows users to view the execution plan of an SQL query. The execution plan is presented in the form of operators, describing how IoTDB will execute the query. The output of Explain includes information such as data access strategies, whether filter conditions are pushed down, and the distribution of the query plan across different nodes, providing users with a means to visualize the internal logic of the query execution. Its syntax is as follows: +## Explain/Explain Analyze Statements -```sql +The purpose of query analysis is to assist users in understanding the execution mechanism and performance bottlenecks of queries, thereby facilitating query optimization and performance enhancement. This is crucial not only for the efficiency of query execution but also for the user experience of applications and the efficient utilization of resources. For effective query analysis, IoTDB versions V1.3.2 and above offer the query analysis statements: Explain and Explain Analyze. + +- Explain Statement: The Explain statement allows users to preview the execution plan of a query SQL, including how IoTDB organizes data retrieval and processing. + +- Explain Analyze Statement: The Explain Analyze statement builds upon the Explain statement by incorporating performance analysis, fully executing the SQL, and displaying the time and resource consumption during the query execution process. This provides IoTDB users with detailed information to deeply understand the details of the query and to perform query optimization. Compared to other common IoTDB troubleshooting methods, Explain Analyze imposes no deployment burden and can analyze [...] + +The comparison of various methods is as follows: + +| Method | Installation Difficulty | Business Impact | Functional Scope | +| :------------------ | :----------------------------------------------------------- | :------------------------------------------------ | :----------------------------------------------------------- | +| Explain Analyze Statement | Low. No additional components are needed; it's a built-in SQL statement of IoTDB. | Low. It only affects the single query being analyzed, with no impact on other online loads. | Supports distributed systems, and can track a single SQL statement. | +| Monitoring Panel | Medium. Requires the installation of the IoTDB monitoring panel tool (an enterprise version tool) and the activation of the IoTDB monitoring service. | Medium. The IoTDB monitoring service's recording of metrics will introduce additional latency. | Supports distributed systems, but only analyzes the overall query load and time consumption of the database. | +| Arthas Sampling | Medium. Requires the installation of the Java Arthas tool (Arthas cannot be directly installed in some intranets, and sometimes a restart of the application is needed after installation). | High. CPU sampling may affect the response speed of online business. | Does not support distributed systems and only analyzes the overall query load and time consumption of the database. | + +### Explain Statement + +#### Syntax + +The Explain command enables users to view the execution plan of a SQL query. The execution plan is presented in the form of operators, describing how IoTDB will execute the query. The syntax is as follows, where SELECT_STATEMENT is the SQL statement related to the query: + +```SQL EXPLAIN <SELECT_STATEMENT> ``` -Where SELECT_STATEMENT is the SQL statement related to the query. An example of usage is as follows: -```sql + +The results returned by Explain include information such as data access strategies, whether filter conditions are pushed down, and how the query plan is distributed across different nodes, providing users with a means to visualize the internal execution logic of the query. + +#### Example + +```SQL + +# Insert data + insert into root.explain.data(timestamp, column1, column2) values(1710494762, "hello", "explain") +# Execute explain statement + explain select * from root.explain.data ``` -Execute the SQL and get the following result: -``` + +Executing the above SQL will yield the following results. It is evident that IoTDB uses two SeriesScan nodes to retrieve the data for column1 and column2, and finally connects them through a fullOuterTimeJoin. + +```Plain +-----------------------------------------------------------------------+ | distribution plan| +-----------------------------------------------------------------------+ @@ -58,49 +83,65 @@ Execute the SQL and get the following result: |└─────────────────────────────────┘ └─────────────────────────────────┘| +-----------------------------------------------------------------------+ ``` -It can be seen that IoTDB retrieves the data for column1 and column2 through two separate SeriesScan nodes, and finally connects them using fullOuterTimeJoin. -#### Explain Analyze -Explain Analyze is a performance analysis SQL built into the IoTDB query engine. Unlike Explain, it executes the corresponding query plan and collects execution information. It can be used to track the specific performance distribution of a query, observe resources, and conduct performance tuning and anomaly analysis. -Compared to other analysis methods where can be attached in IoTDB, Explain Analyze does not require deployment effort and can analyze individual SQL statements, allowing for more precise problem identification: +### Explain Analyze Statement -|Method|Installation Difficulty|Impact on Business|Supports Distributed System|Analysis of Individual SQL| -|:----|:----|:----|:----|:----| -|Arthas Sampling|Requires downloading and running files on the machine: some internal networks cannot directly install Arthas; and sometimes, it requires restarting the application after installation|CPU sampling may affect the response speed of online business|No|Online businesses usually have various query loads, and the overall monitoring metrics and sampling results can only reflect the overall load and response times of all queries, unable to analyze the response time of individual [...] -|Monitor Tool|Requires enabling monitoring services or deploying Grafana, and open-source users do not have a monitoring dashboard|Recording metrics will bring additional response time|Yes| Same as Arthas| -|Explain Analyze|No installation required, available upon starting IoTDB|Only affects the single query being analyzed, with no impact on other online loads|Yes|Allows for tracking and analysis of individual SQL statements| +#### Syntax -Its syntax is as following: -```sql +Explain Analyze is a performance analysis SQL that comes with the IoTDB query engine. Unlike Explain, it executes the corresponding query plan and collects execution information, which can be used to track the specific performance distribution of a query, for observing resources, performance tuning, and anomaly analysis. The syntax is as follows: + +```SQL EXPLAIN ANALYZE [VERBOSE] <SELECT_STATEMENT> ``` -In it, SELECT_STATEMENT corresponds to the query statement to be analyzed. By default, in order to simplify the results as much as possible, EXPLAIN ANALYZE will omit some information. Specifying VERBOSE can be used to output this information. -The result set of EXPLAIN ANALYZE will include the following information: +Where SELECT_STATEMENT corresponds to the query statement that needs to be analyzed; VERBOSE prints detailed analysis results, and when VERBOSE is not filled in, EXPLAIN ANALYZE will omit some information. + +In the EXPLAIN ANALYZE result set, the following information is included: - -QueryStatistics contains the statistical information at the query level, primarily including the time consumed during the plan parsing phase, Fragment metadata, and other information. + -FragmentInstance is IoTDB's encapsulation of a query plan on a node. Each node will output a Fragment information in the result set, mainly including FragmentStatistics and operator information. -FragmentStatistics includes the statistical information of a Fragment, such as the total actual duration (wall-clock time), the TsFiles involved, scheduling information, etc. The information of a Fragment is also displayed in a tree hierarchy of plan nodes within that Fragment, including: -* CPU runtime -* Number of output rows -* Number of times a specific interface is called -* Memory usage -* Node-specific custom information +- QueryStatistics contains statistical information at the query level, mainly including the time spent in the planning and parsing phase, Fragment metadata, and other information. +- FragmentInstance is an encapsulation of the query plan on a node by IoTDB. Each node will output a Fragment information in the result set, mainly including FragmentStatistics and operator information. FragmentStatistics contains statistical information of the Fragment, including total actual time (wall time), TsFile involved, scheduling information, etc. At the same time, the statistical information of the plan nodes under this Fragment will be displayed in a hierarchical way of the no [...] -Below is an example of Explain Analyze: +#### Special Instructions + +1. Simplification of Explain Analyze Statement Results + +Since the Fragment will output all the node information executed in the current node, when a query involves too many series, each node is output, which will cause the result set returned by Explain Analyze to be too large. Therefore, when the same type of node exceeds 10, the system will automatically merge all the same types of nodes under the current Fragment, and the merged statistical information is also accumulated. Some custom information that cannot be merged will be directly disc [...] + + + +Users can also modify the configuration item `merge_threshold_of_explain_analyze` in `iotdb-system.properties` to set the threshold for triggering the merge of nodes. This parameter supports hot loading. + +2. Use of Explain Analyze Statement in Query Timeout Scenarios + +Explain Analyze itself is a special query. When the execution times out, it cannot be analyzed with the Explain Analyze statement. In order to be able to investigate the cause of the timeout through the analysis results even when the query times out, Explain Analyze also provides a timing log mechanism (no user configuration is required), which will output the current results of Explain Analyze in the form of text to a special log at a certain time interval. When the query times out, use [...] + +The time interval of the log is calculated based on the query timeout time to ensure that at least two result records will be saved before the timeout. + +#### Example + +Here is an example of Explain Analyze: + +```SQL + +# Insert data -```sql insert into root.explain.analyze.data(timestamp, column1, column2, column3) values(1710494762, "hello", "explain", "analyze") insert into root.explain.analyze.data(timestamp, column1, column2, column3) values(1710494862, "hello2", "explain2", "analyze2") insert into root.explain.analyze.data(timestamp, column1, column2, column3) values(1710494962, "hello3", "explain3", "analyze3") + +# Execute explain analyze statement + explain analyze select column2 from root.explain.analyze.data order by column1 ``` -Get result following: -``` + +The output is as follows: + + +```Plain +-------------------------------------------------------------------------------------------------+ | Explain Analyze| +-------------------------------------------------------------------------------------------------+ @@ -157,16 +198,10 @@ Get result following: | SeriesPath: root.explain.analyze.data.column1 | +-------------------------------------------------------------------------------------------------+ ``` -##### PlanNode Compaction in the Result Of EXPLAIN ANALYZE - - - -In a Fragment, the information of all nodes executed in the current node will be output. However, when a query involves too many series, outputting each seriesScanNode can lead to an excessively large result set from Explain Analyze. Therefore, when the same type of nodes exceeds 10, all nodes of the same type under the current Fragment will be merged. The statistical information is also accumulated after the merge, and some customized information that cannot be merged will be directly d [...] +Example of Partial Results After Triggering Merge: -The threshold for triggering the merge of nodes can be set by modifying the configuration item `merge_threshold_of_explain_analyze` in iotdb-system.properties, and this parameter supports hot loading. Below is a part of the result example after triggering a merge: - -``` +```Plain Analyze Cost: 143.679 ms Fetch Partition Cost: 22.023 ms Fetch Schema Cost: 63.086 ms @@ -234,7 +269,80 @@ FRAGMENT-INSTANCE[Id: 20240311_041502_00001_1.3.0][IP: 192.168.130.9][DataRegion ``` -##### Query Timeout Handling -Explain Analyze is a unique type of query. When it times out, we are unable to obtain the analysis results from the return. To address this, allowing for the investigation of timeout reasons through analysis results even in cases of timeout, Explain Analyze offers a timed logging mechanism. After certain intervals, the current results of Explain Analyze are output in text form to a dedicated log file. This way, when a query times out, one can go to the logs to investigate the correspondi [...] +### Common Issues + +#### What is the difference between WALL TIME and CPU TIME? + +CPU time, also known as processor time or CPU usage time, refers to the actual time the CPU is occupied with computation during the execution of a program, indicating the actual consumption of processor resources by the program. + +Wall time, also known as real time or physical time, refers to the total time from the start to the end of a program's execution, including all waiting times. + +1. Scenarios where WALL TIME < CPU TIME: For example, a query slice is finally executed in parallel by the scheduler using two threads. In the real physical world, 10 seconds have passed, but the two threads may have occupied two CPU cores and run for 10 seconds each, so the CPU time would be 20 seconds, while the wall time would be 10 seconds. + +2. Scenarios where WALL TIME > CPU TIME: Since there may be multiple queries running in parallel within the system, but the number of execution threads and memory is fixed, + 1. So when a query slice is blocked by some resources (such as not having enough memory for data transfer or waiting for upstream data), it will be put into the Blocked Queue. At this time, the query slice will not occupy CPU time, but the WALL TIME (real physical time) is still advancing. + 2. Or when the query thread resources are insufficient, for example, there are currently 16 query threads in total, but there are 20 concurrent query slices within the system. Even if all queries are not blocked, only 16 query slices can run in parallel at the same time, and the other four will be put into the READY QUEUE, waiting to be scheduled for execution. At this time, the query slice will not occupy CPU time, but the WALL TIME (real physical time) is still advancing. + +#### Is there any additional overhead with Explain Analyze, and is the measured time different from when the query is actually executed? + +Almost none, because the explain analyze operator is executed by a separate thread to collect the statistical information of the original query, and these statistical information, even if not explain analyze, the original query will also generate, but no one goes to get it. And explain analyze is a pure next traversal of the result set, which will not be printed, so there will be no significant difference from the actual execution time of the original query. + +#### What are the main indicators to focus on for IO time consumption? + +The main indicators that may involve IO time consumption are loadTimeSeriesMetadataDiskSeqTime, loadTimeSeriesMetadataDiskUnSeqTime, and construct[NonAligned/Aligned]ChunkReadersDiskTime. + +The loading of TimeSeriesMetadata statistics is divided into sequential and unaligned files, but the reading of Chunks is not temporarily separated, but the proportion of sequential and unaligned can be calculated based on the proportion of TimeSeriesMetadata. + +#### Can the impact of unaligned data on query performance be demonstrated with some indicators? + +There are mainly two impacts of unaligned data: + +1. An additional merge sort needs to be done in memory (it is generally believed that this time consumption is relatively short, after all, it is a pure memory CPU operation) + +2. Unaligned data will generate overlapping time ranges between data blocks, making statistical information unusable + 1. Unable to directly skip the entire chunk that does not meet the value filtering requirements using statistical information + 1. Generally, the user's query only includes time filtering conditions, so there will be no impact + 2. Unable to directly calculate the aggregate value using statistical information without reading the data + +At present, there is no effective observation method for the performance impact of unaligned data alone, unless a query is executed when there is unaligned data, and then executed again after the unaligned data is merged, in order to compare. + +Because even if this part of the unaligned data is entered into the sequence, IO, compression, and decoding are also required. This time cannot be reduced, and it will not be reduced just because the unaligned data has been merged into the unaligned. + +#### Why is there no output in the log_explain_analyze.log when the query times out during the execution of explain analyze? + +During the upgrade, only the lib package was replaced, and the conf/logback-datanode.xml was not replaced. It needs to be replaced, and there is no need to restart (the content of this file can be hot loaded). After waiting for about 1 minute, re-execute explain analyze verbose. + + +### Practical Case Studies + +#### Case Study 1: The query involves too many files, and disk IO becomes a bottleneck, causing the query speed to slow down. + + + +The total query time is 938 ms, of which the time to read the index area and data area from the files accounts for 918 ms, involving a total of 289 files. Assuming the query involves N TsFiles, the theoretical time for the first query (not hitting the cache) is cost = N * (t_seek + t_index + t_seek + t_chunk). Based on experience, the time for a single seek on an HDD disk is about 5-10ms, so the more files involved in the query, the greater the query delay will be. + +The final optimization plan is: + +1. Adjust the merge parameters to reduce the number of files + +2. Replace HDD with SSD to reduce the latency of a single disk IO + + +#### Case Study 2: The execution of the like predicate is slow, causing the query to time out + +When executing the following SQL, the query times out (the default timeout is 60 seconds) + +```SQL +select count(s1) as total from root.db.d1 where s1 like '%XXXXXXXX%' +``` + +When executing explain analyze verbose, even if the query times out, the intermediate collection results will be output to log_explain_analyze.log every 15 seconds. The last two outputs obtained from log_explain_analyze.log are as follows: + + + + + + +Observing the results, we found that it is because the query did not add a time condition, involving too much data, and the time of constructAlignedChunkReadersDiskTime and pageReadersDecodeAlignedDiskTime has been increasing, which means that new chunks are being read all the time. However, the output information of AlignedSeriesScanNode has always been 0, because the operator only gives up the time slice and updates the information when at least one line of data that meets the conditio [...] -The logging interval is calculated based on the query's timeout setting, ensuring that there are at least two records of results in case of a timeout. \ No newline at end of file +The final optimization plan is: Add a time filtering condition to avoid a full table scan. \ No newline at end of file diff --git a/src/zh/UserGuide/Master/User-Manual/Maintennance.md b/src/zh/UserGuide/Master/User-Manual/Maintennance.md index 7fc2807..112a76f 100644 --- a/src/zh/UserGuide/Master/User-Manual/Maintennance.md +++ b/src/zh/UserGuide/Master/User-Manual/Maintennance.md @@ -18,29 +18,46 @@ under the License. --> - # 运维语句 -## 查询分析 -### 概述 -查询分析的意义在于帮助用户理解查询的执行机制和性能瓶颈,从而实现查询优化和性能提升。这不仅关乎到查询的执行效率,也直接影响到应用的用户体验和资源的有效利用。为了进行有效的查询分析,IoTDB提供了查询分析工具:Explain和Explain Analyze。 +## Explain/Explain Analyze 语句 + +查询分析的意义在于帮助用户理解查询的执行机制和性能瓶颈,从而实现查询优化和性能提升。这不仅关乎到查询的执行效率,也直接影响到应用的用户体验和资源的有效利用。为了进行有效的查询分析,**IoTDB** **V1.3.2及以上版本**提供了查询分析语句:Explain 和 Explain Analyze。 + +- Explain 语句:允许用户预览查询 SQL 的执行计划,包括 IoTDB 如何组织数据检索和处理。 +- Explain Analyze 语句:在 Explain 语句基础上增加了性能分析,完整执行SQL并展示查询执行过程中的时间和资源消耗。为IoTDB用户深入理解查询详情以及进行查询优化提供了详细的相关信息。与其他常用的 IoTDB 排查手段相比,Explain Analyze 没有部署负担,同时能够针对单条 sql 进行分析,能够更好定位问题。各类方法对比如下: + +| 方法 | 安装难度 | 业务影响 | 功能范围 | +| :------------------ | :----------------------------------------------------------- | :--------------------------------------------------- | :----------------------------------------------------- | +| Explain Analyze语句 | 低。无需安装额外组件,为IoTDB内置SQL语句 | 低。只会影响当前分析的单条查询,对线上其他负载无影响 | 支持分布式,可支持对单条SQL进行追踪 | +| 监控面板 | 中。需要安装IoTDB监控面板工具(企业版工具),并开启IoTDB监控服务 | 中。IoTDB监控服务记录指标会带来额外耗时 | 支持分布式,仅支持对数据库整体查询负载和耗时进行分析 | +| Arthas抽样 | 中。需要安装Java Arthas工具(部分内网无法直接安装Arthas,且安装后,有时需要重启应用) | 高。CPU 抽样可能会影响线上业务的响应速度 | 不支持分布式,仅支持对数据库整体查询负载和耗时进行分析 | -Explain工具允许用户预览查询SQL的执行计划,包括IoTDB如何组织数据检索和处理。 +### Explain 语句 -Explain Analyze则在此基础上增加了性能分析,完整执行SQL并展示查询执行过程中的时间和资源消耗。为IoTDB用户深入理解查询详情以及进行查询优化提供了详细的相关信息。 -#### Explain -Explain命令允许用户查看SQL查询的执行计划。执行计划以算子的形式展示,描述了IoTDB会如何执行查询。Explain的输出包括了数据访问策略、过滤条件是否下推以及查询计划在不同节点的分配等信息,为用户提供了一种手段,以可视化查询的内部执行逻辑。其语法如下: -```sql +#### 语法 + +Explain命令允许用户查看SQL查询的执行计划。执行计划以算子的形式展示,描述了IoTDB会如何执行查询。其语法如下,其中SELECT_STATEMENT是查询相关的SQL语句: + +```SQL EXPLAIN <SELECT_STATEMENT> ``` -其中SELECT_STATEMENT是查询相关的SQL语句。一个使用案例如下: -```sql + +Explain的返回结果包括了数据访问策略、过滤条件是否下推以及查询计划在不同节点的分配等信息,为用户提供了一种手段,以可视化查询的内部执行逻辑。 + +#### 示例 + +```SQL +# 插入数据 insert into root.explain.data(timestamp, column1, column2) values(1710494762, "hello", "explain") +# 执行explain语句 explain select * from root.explain.data ``` -执行上方SQL,会得到如下结果: -``` + +执行上方SQL,会得到如下结果。不难看出,IoTDB分别通过两个SeriesScan节点去获取column1和column2的数据,最后通过fullOuterTimeJoin将其连接。 + +```Plain +-----------------------------------------------------------------------+ | distribution plan| +-----------------------------------------------------------------------+ @@ -57,48 +74,61 @@ explain select * from root.explain.data |└─────────────────────────────────┘ └─────────────────────────────────┘| +-----------------------------------------------------------------------+ ``` -不难看出,IoTDB分别通过两个SeriesScan节点去获取column1和column2的数据,最后通过fullOuterTimeJoin将其连接。 -#### Explain Analyze -Explain Analyze是IOTDB查询引擎自带的性能分析SQL,与Explain不同,它会执行对应的查询计划并统计执行信息,可以用于追踪一条查询的具体性能分布,用于对资源进行观察,进行性能调优与异常分析。 -与IoTDB常用的排查手段相比,Explain Analyze没有部署负担,同时能够针对单条sql进行分析,能够更好定位问题: +### Explain Analyze 语句 -|方法|安装难度|对业务的影响|支持分布式|单条sql分析| -|:----|:----|:----|:----|:----| -|Arthas抽样|需要在机器上下载并运行文件:部分内网无法直接安装Arthas ;且安装后,有时需要重启应用|CPU 抽样可能会影响线上业务的响应速度|否|线上业务通常都有多种查询负载,整体的监控指标以及抽样结果,只能反映所有查询的整体负载和耗时情况,无法对单条慢sql做耗时分析| -|监控面板|需要开启监控服务并部署grafana,且开源用户没有监控面板|记录指标会带来额外耗时|是| 与Arthas相同| -|Explain Analyze|无需安装,启动IoTDB即可|只会影响当前分析的单条查询,对线上其他负载无影响|是|可以对单条sql进行追踪分析| +#### 语法 -其语法如下: -```sql +Explain Analyze 是 IOTDB 查询引擎自带的性能分析 SQL,与 Explain 不同,它会执行对应的查询计划并统计执行信息,可以用于追踪一条查询的具体性能分布,用于对资源进行观察,进行性能调优与异常分析。其语法如下: + +```SQL EXPLAIN ANALYZE [VERBOSE] <SELECT_STATEMENT> ``` -其中SELECT_STATEMENT对应需要分析的查询语句;默认情况下,为了尽可能简化结果,EXPLAIN ANALYZE会省略部分信息,指定VERBOSE可以用来输出这些信息。 -在EXPLAIN ANALYZE的结果集中,会包含如下信息 +其中SELECT_STATEMENT对应需要分析的查询语句;VERBOSE为打印详细分析结果,不填写VERBOSE时EXPLAIN ANALYZE将会省略部分信息。 + +在EXPLAIN ANALYZE的结果集中,会包含如下信息: + + - +其中: -其中,QueryStatistics包含查询层面进的统计信息,主要包含规划解析阶段耗时,Fragment元数据等信息。 +- QueryStatistics包含查询层面进的统计信息,主要包含规划解析阶段耗时,Fragment元数据等信息。 +- FragmentInstance是IoTDB在一个节点上查询计划的封装,每一个节点都会在结果集中输出一份Fragment信息,主要包含FragmentStatistics和算子信息。FragmentStastistics包含Fragment的统计信息,包括总实际耗时(墙上时间),所涉及到的TsFile,调度信息等情况。在一个Fragment的信息输出同时会以节点树层级的方式展示该Fragment下计划节点的统计信息,主要包括:CPU运行时间、输出的数据行数、指定接口被调用的次数、所占用的内存、节点专属的定制信息。 -FragmentInstance是IoTDB在一个节点上查询计划的封装,每一个节点都会在结果集中输出一份Fragment信息,主要包含FragmentStatistics和算子信息。 +#### 特别说明 -其中,FragmentStastistics包含Fragment的统计信息,包括总实际耗时(墙上时间),所涉及到的TsFile,调度信息等情况。在一个Fragment的信息输出同时会以节点树层级的方式展示该Fragment下计划节点的统计信息,主要包括: -* CPU运行时间 -* 输出的数据行数 -* 指定接口被调用的次数 -* 所占用的内存 -* 节点专属的定制信息 +1. Explain Analyze 语句的结果简化 -下面是Explain Analyze的一个样例: -```sql +由于在 Fragment 中会输出当前节点中执行的所有节点信息,当一次查询涉及的序列过多时,每个节点都被输出,会导致 Explain Analyze 返回的结果集过大,因此当相同类型的节点超过 10 个时,系统会自动合并当前 Fragment 下所有相同类型的节点,合并后统计信息也被累积,对于一些无法合并的定制信息会直接丢弃(如下图)。 + + + +用户也可以自行修改 iotdb-system.properties 中的配置项`merge_threshold_of_explain_analyze`来设置触发合并的节点阈值,该参数支持热加载。 + +2. 查询超时场景使用 Explain Analyze 语句 + +Explain Analyze 本身是一种特殊的查询,当执行超时的时候,无法使用Explain Analyze语句进行分析。为了在查询超时的情况下也可以通过分析结果排查超时原因,Explain Analyze还提供了**定时日志**机制(无需用户配置),每经过一定的时间间隔会将 Explain Analyze 的当前结果以文本的形式输出到专门的日志中。当查询超时时,用户可以前往logs/log_explain_analyze.log中查看对应的日志进行排查。 + +日志的时间间隔基于查询的超时时间进行计算,可以保证在超时的情况下至少会有两次的结果记录。 + +#### 示例 + +下面是Explain Analyze的一个例子: + +```SQL +# 插入数据 insert into root.explain.analyze.data(timestamp, column1, column2, column3) values(1710494762, "hello", "explain", "analyze") insert into root.explain.analyze.data(timestamp, column1, column2, column3) values(1710494862, "hello2", "explain2", "analyze2") insert into root.explain.analyze.data(timestamp, column1, column2, column3) values(1710494962, "hello3", "explain3", "analyze3") + +# 执行explain analyze语句 explain analyze select column2 from root.explain.analyze.data order by column1 ``` + 得到输出如下: -``` + +```Plain +-------------------------------------------------------------------------------------------------+ | Explain Analyze| +-------------------------------------------------------------------------------------------------+ @@ -155,15 +185,10 @@ explain analyze select column2 from root.explain.analyze.data order by column1 | SeriesPath: root.explain.analyze.data.column1 | +-------------------------------------------------------------------------------------------------+ ``` -##### EXPLAIN ANALYZE分析结果中的算子压缩 - +触发合并后的部分结果示例如下: -在Fragment中会输出当前节点中执行的所有节点信息,然而当一次查询涉及的序列过多时,每个节点都被输出会导致Explain Analyze返回的结果集过大,因此当相同类型的节点超过10个时,会合并当前Fragment下所有相同类型的节点。合并后统计信息也被累积,对于一些无法合并的定制信息会直接丢弃。 - -可以通过修改iotdb-system.properties中的配置项`merge_threshold_of_explain_analyze`来设置触发合并的节点阈值,该参数支持热加载。下面是一个触发合并后的部分结果示例: - -``` +```Plain Analyze Cost: 143.679 ms Fetch Partition Cost: 22.023 ms Fetch Schema Cost: 63.086 ms @@ -230,8 +255,74 @@ FRAGMENT-INSTANCE[Id: 20240311_041502_00001_1.3.0][IP: 192.168.130.9][DataRegion ...... ``` -##### 查询超时处理 +### 常见问题 + +#### WALL TIME(墙上时间)和 CPU TIME(CPU时间)的区别? + +CPU 时间也称为处理器时间或处理器使用时间,指的是程序在执行过程中实际占用 CPU 进行计算的时间,显示的是程序实际消耗的处理器资源。 + +墙上时间也称为实际时间或物理时间,指的是从程序开始执行到程序结束的总时间,包括了所有等待时间。 + +1. WALL TIME < CPU TIME 的场景:比如一个查询分片最后被调度器使用两个线程并行执行,真实物理世界上是 10s 过去了,但两个线程,可能一直占了两个 cpu 核跑了 10s,那 cpu time 就是 20s,wall time就是 10s +2. WALL TIME > CPU TIME 的场景:因为系统内可能会存在多个查询并行执行,但查询的执行线程数和内存是固定的, + 1. 所以当查询分片被某些资源阻塞住时(比如没有足够的内存进行数据传输、或等待上游数据)就会放入Blocked Queue,此时查询分片并不会占用 CPU TIME,但WALL TIME(真实物理时间的时间)是在向前流逝的 + 2. 或者当查询线程资源不足时,比如当前共有16个查询线程,但系统内并发有20个查询分片,即使所有查询都没有被阻塞,也只会同时并行运行16个查询分片,另外四个会被放入 READY QUEUE,等待被调度执行,此时查询分片并不会占用 CPU TIME,但WALL TIME(真实物理时间的时间)是在向前流逝的 + +#### Explain Analyze 是否有额外开销,测出的耗时是否与查询真实执行时有差别? + +几乎没有,因为 explain analyze operator 是单独的线程执行,收集原查询的统计信息,且这些统计信息,即使不explain analyze,原来的查询也会生成,只是没有人去取。并且 explain analyze 是纯 next 遍历结果集,不会打印,所以与原来查询真实执行时的耗时不会有显著差别。 + +#### IO 耗时主要关注几个指标? + +可能涉及 IO 耗时的主要有个指标,loadTimeSeriesMetadataDiskSeqTime, loadTimeSeriesMetadataDiskUnSeqTime 以及 construct[NonAligned/Aligned]ChunkReadersDiskTime + +TimeSeriesMetadata 的加载分别统计了顺序和乱序文件,但 Chunk 的读取暂时未分开统计,但顺乱序比例可以通过TimeseriesMetadata 顺乱序的比例计算出来。 + +#### 乱序数据对查询性能的影响能否有一些指标展示出来? + +乱序数据产生的影响主要有两个: + +1. 需要在内存中多做一个归并排序(一般认为这个耗时是比较短的,毕竟是纯内存的 cpu 操作) +2. 乱序数据会产生数据块间的时间范围重叠,导致统计信息无法使用 + 1. 无法利用统计信息直接 skip 掉整个不满足值过滤要求的 chunk + 1. 一般用户的查询都是只包含时间过滤条件,则不会有影响 + 2. 无法利用统计信息直接计算出聚合值,无需读取数据 + +单独对于乱序数据的性能影响,目前并没有有效的观测手段,除非就是在有乱序数据的时候,执行一遍查询耗时,然后等乱序合完了,再执行一遍,才能对比出来。 + +因为即使乱序这部分数据进了顺序,也是需要 IO、加压缩、decode,这个耗时少不了,不会因为乱序数据被合并进乱序了,就减少了。 + +#### 执行 explain analyze 时,查询超时后,为什么结果没有输出在 log_explain_analyze.log 中? + +升级时,只替换了 lib 包,没有替换 conf/logback-datanode.xml,需要替换一下 conf/logback-datanode.xml,然后不需要重启(该文件内容可以被热加载),大约等待 1 分钟后,重新执行 explain analyze verbose。 + +### 实战案例 + +#### 案例一:查询涉及文件数量过多,磁盘IO成为瓶颈,导致查询速度变慢 + + + +查询总耗时为 938 ms,其中从文件中读取索引区和数据区的耗时占据 918 ms,涉及了总共 289 个文件,假设查询涉及 N 个 TsFile,磁盘单次 seek 耗时为 t_seek,读取文件尾部索引的耗时为 t_index,读取文件的数据块的耗时为 t_chunk,则首次查询(未命中缓存)的理论耗时为 `cost = N * (t_seek + t_index + t_seek + t_chunk)`,按经验值,HDD 磁盘的一次 seek 耗时约为 5-10ms,所以查询涉及的文件数越多,查询延迟会越大。 + +最终优化方案为: + +1. 调整合并参数,降低文件数量 +2. 更换 HDD 为 SSD,降低磁盘单次 IO 的延迟 + +#### 案例二:like 谓词执行慢导致查询超时 + +执行如下 sql 时,查询超时(默认超时时间为 60s) + +```SQL +select count(s1) as total from root.db.d1 where s1 like '%XXXXXXXX%' +``` + +执行 explain analyze verbose 时,即使查询超时,也会每隔 15s,将阶段性的采集结果输出到 log_explain_analyze.log 中,从 log_explain_analyze.log 中得到最后两次的输出结果如下: + + + + -Explain Analyze本身是一种特殊的查询,当执行超时的时候,我们是无法从返回结果中获得分析结果的。为了处理该情况,使得在超时的情况下也可以通过分析结果排查超时原因,Explain Analyze提供了**定时日志**机制,每经过一定的时间间隔会将Explain Analyze的当前结果以文本的形式输出到专门的日志中。这样当查询超时时,就可以前往logs中查看对应的日志进行排查。 +观察结果,我们发现是因为查询未加时间条件,涉及的数据太多 constructAlignedChunkReadersDiskTime 和 pageReadersDecodeAlignedDiskTime的耗时一直在涨,意味着一直在读新的 chunk。但 AlignedSeriesScanNode 的输出信息一直是 0,这是因为算子只有在输出至少一行满足条件的数据时,才会让出时间片,并更新信息。从总的读取耗时(loadTimeSeriesMetadataAlignedDiskSeqTime + loadTimeSeriesMetadataAlignedDiskUnSeqTime + constructAlignedChunkReadersDiskTime + pageReadersDecodeAlignedDiskTime=约13.4秒)来看,其他耗时(60s - 13.4 = 46.6)应该都是在执行过滤条件上(like 谓词的执行很耗时)。 -日志的时间间隔基于查询的超时时间进行计算,可以保证在超时的情况下至少会有两次的结果记录。 \ No newline at end of file +最终优化方案为:增加时间过滤条件,避免全表扫描 \ No newline at end of file diff --git a/src/zh/UserGuide/latest/User-Manual/Maintennance.md b/src/zh/UserGuide/latest/User-Manual/Maintennance.md index 7fc2807..43e7b7a 100644 --- a/src/zh/UserGuide/latest/User-Manual/Maintennance.md +++ b/src/zh/UserGuide/latest/User-Manual/Maintennance.md @@ -18,29 +18,46 @@ under the License. --> - # 运维语句 -## 查询分析 -### 概述 -查询分析的意义在于帮助用户理解查询的执行机制和性能瓶颈,从而实现查询优化和性能提升。这不仅关乎到查询的执行效率,也直接影响到应用的用户体验和资源的有效利用。为了进行有效的查询分析,IoTDB提供了查询分析工具:Explain和Explain Analyze。 +## Explain/Explain Analyze 语句 + +查询分析的意义在于帮助用户理解查询的执行机制和性能瓶颈,从而实现查询优化和性能提升。这不仅关乎到查询的执行效率,也直接影响到应用的用户体验和资源的有效利用。为了进行有效的查询分析,**IoTDB** **V1.3.2及以上版本**提供了查询分析语句:Explain 和 Explain Analyze。 + +- Explain 语句:允许用户预览查询 SQL 的执行计划,包括 IoTDB 如何组织数据检索和处理。 +- Explain Analyze 语句:在 Explain 语句基础上增加了性能分析,完整执行SQL并展示查询执行过程中的时间和资源消耗。为IoTDB用户深入理解查询详情以及进行查询优化提供了详细的相关信息。与其他常用的 IoTDB 排查手段相比,Explain Analyze 没有部署负担,同时能够针对单条 sql 进行分析,能够更好定位问题。各类方法对比如下: + +| 方法 | 安装难度 | 业务影响 | 功能范围 | +| :------------------ | :----------------------------------------------------------- | :--------------------------------------------------- | :----------------------------------------------------- | +| Explain Analyze语句 | 低。无需安装额外组件,为IoTDB内置SQL语句 | 低。只会影响当前分析的单条查询,对线上其他负载无影响 | 支持分布式,可支持对单条SQL进行追踪 | +| 监控面板 | 中。需要安装IoTDB监控面板工具(企业版工具),并开启IoTDB监控服务 | 中。IoTDB监控服务记录指标会带来额外耗时 | 支持分布式,仅支持对数据库整体查询负载和耗时进行分析 | +| Arthas抽样 | 中。需要安装Java Arthas工具(部分内网无法直接安装Arthas,且安装后,有时需要重启应用) | 高。CPU 抽样可能会影响线上业务的响应速度 | 不支持分布式,仅支持对数据库整体查询负载和耗时进行分析 | -Explain工具允许用户预览查询SQL的执行计划,包括IoTDB如何组织数据检索和处理。 +### Explain 语句 -Explain Analyze则在此基础上增加了性能分析,完整执行SQL并展示查询执行过程中的时间和资源消耗。为IoTDB用户深入理解查询详情以及进行查询优化提供了详细的相关信息。 -#### Explain -Explain命令允许用户查看SQL查询的执行计划。执行计划以算子的形式展示,描述了IoTDB会如何执行查询。Explain的输出包括了数据访问策略、过滤条件是否下推以及查询计划在不同节点的分配等信息,为用户提供了一种手段,以可视化查询的内部执行逻辑。其语法如下: -```sql +#### 语法 + +Explain命令允许用户查看SQL查询的执行计划。执行计划以算子的形式展示,描述了IoTDB会如何执行查询。其语法如下,其中SELECT_STATEMENT是查询相关的SQL语句: + +```SQL EXPLAIN <SELECT_STATEMENT> ``` -其中SELECT_STATEMENT是查询相关的SQL语句。一个使用案例如下: -```sql + +Explain的返回结果包括了数据访问策略、过滤条件是否下推以及查询计划在不同节点的分配等信息,为用户提供了一种手段,以可视化查询的内部执行逻辑。 + +#### 示例 + +```SQL +# 插入数据 insert into root.explain.data(timestamp, column1, column2) values(1710494762, "hello", "explain") +# 执行explain语句 explain select * from root.explain.data ``` -执行上方SQL,会得到如下结果: -``` + +执行上方SQL,会得到如下结果。不难看出,IoTDB分别通过两个SeriesScan节点去获取column1和column2的数据,最后通过fullOuterTimeJoin将其连接。 + +```Plain +-----------------------------------------------------------------------+ | distribution plan| +-----------------------------------------------------------------------+ @@ -57,48 +74,61 @@ explain select * from root.explain.data |└─────────────────────────────────┘ └─────────────────────────────────┘| +-----------------------------------------------------------------------+ ``` -不难看出,IoTDB分别通过两个SeriesScan节点去获取column1和column2的数据,最后通过fullOuterTimeJoin将其连接。 -#### Explain Analyze -Explain Analyze是IOTDB查询引擎自带的性能分析SQL,与Explain不同,它会执行对应的查询计划并统计执行信息,可以用于追踪一条查询的具体性能分布,用于对资源进行观察,进行性能调优与异常分析。 -与IoTDB常用的排查手段相比,Explain Analyze没有部署负担,同时能够针对单条sql进行分析,能够更好定位问题: +### Explain Analyze 语句 -|方法|安装难度|对业务的影响|支持分布式|单条sql分析| -|:----|:----|:----|:----|:----| -|Arthas抽样|需要在机器上下载并运行文件:部分内网无法直接安装Arthas ;且安装后,有时需要重启应用|CPU 抽样可能会影响线上业务的响应速度|否|线上业务通常都有多种查询负载,整体的监控指标以及抽样结果,只能反映所有查询的整体负载和耗时情况,无法对单条慢sql做耗时分析| -|监控面板|需要开启监控服务并部署grafana,且开源用户没有监控面板|记录指标会带来额外耗时|是| 与Arthas相同| -|Explain Analyze|无需安装,启动IoTDB即可|只会影响当前分析的单条查询,对线上其他负载无影响|是|可以对单条sql进行追踪分析| +#### 语法 -其语法如下: -```sql +Explain Analyze 是 IOTDB 查询引擎自带的性能分析 SQL,与 Explain 不同,它会执行对应的查询计划并统计执行信息,可以用于追踪一条查询的具体性能分布,用于对资源进行观察,进行性能调优与异常分析。其语法如下: + +```SQL EXPLAIN ANALYZE [VERBOSE] <SELECT_STATEMENT> ``` -其中SELECT_STATEMENT对应需要分析的查询语句;默认情况下,为了尽可能简化结果,EXPLAIN ANALYZE会省略部分信息,指定VERBOSE可以用来输出这些信息。 -在EXPLAIN ANALYZE的结果集中,会包含如下信息 +其中SELECT_STATEMENT对应需要分析的查询语句;VERBOSE为打印详细分析结果,不填写VERBOSE时EXPLAIN ANALYZE将会省略部分信息。 + +在EXPLAIN ANALYZE的结果集中,会包含如下信息: + + - +其中: -其中,QueryStatistics包含查询层面进的统计信息,主要包含规划解析阶段耗时,Fragment元数据等信息。 +- QueryStatistics包含查询层面进的统计信息,主要包含规划解析阶段耗时,Fragment元数据等信息。 +- FragmentInstance是IoTDB在一个节点上查询计划的封装,每一个节点都会在结果集中输出一份Fragment信息,主要包含FragmentStatistics和算子信息。FragmentStastistics包含Fragment的统计信息,包括总实际耗时(墙上时间),所涉及到的TsFile,调度信息等情况。在一个Fragment的信息输出同时会以节点树层级的方式展示该Fragment下计划节点的统计信息,主要包括:CPU运行时间、输出的数据行数、指定接口被调用的次数、所占用的内存、节点专属的定制信息。 -FragmentInstance是IoTDB在一个节点上查询计划的封装,每一个节点都会在结果集中输出一份Fragment信息,主要包含FragmentStatistics和算子信息。 +#### 特别说明 -其中,FragmentStastistics包含Fragment的统计信息,包括总实际耗时(墙上时间),所涉及到的TsFile,调度信息等情况。在一个Fragment的信息输出同时会以节点树层级的方式展示该Fragment下计划节点的统计信息,主要包括: -* CPU运行时间 -* 输出的数据行数 -* 指定接口被调用的次数 -* 所占用的内存 -* 节点专属的定制信息 +1. Explain Analyze 语句的结果简化 -下面是Explain Analyze的一个样例: -```sql +由于在 Fragment 中会输出当前节点中执行的所有节点信息,当一次查询涉及的序列过多时,每个节点都被输出,会导致 Explain Analyze 返回的结果集过大,因此当相同类型的节点超过 10 个时,系统会自动合并当前 Fragment 下所有相同类型的节点,合并后统计信息也被累积,对于一些无法合并的定制信息会直接丢弃(如下图)。 + + + +用户也可以自行修改 iotdb-common.properties 中的配置项`merge_threshold_of_explain_analyze`来设置触发合并的节点阈值,该参数支持热加载。 + +2. 查询超时场景使用 Explain Analyze 语句 + +Explain Analyze 本身是一种特殊的查询,当执行超时的时候,无法使用Explain Analyze语句进行分析。为了在查询超时的情况下也可以通过分析结果排查超时原因,Explain Analyze还提供了**定时日志**机制(无需用户配置),每经过一定的时间间隔会将 Explain Analyze 的当前结果以文本的形式输出到专门的日志中。当查询超时时,用户可以前往logs/log_explain_analyze.log中查看对应的日志进行排查。 + +日志的时间间隔基于查询的超时时间进行计算,可以保证在超时的情况下至少会有两次的结果记录。 + +#### 示例 + +下面是Explain Analyze的一个例子: + +```SQL +# 插入数据 insert into root.explain.analyze.data(timestamp, column1, column2, column3) values(1710494762, "hello", "explain", "analyze") insert into root.explain.analyze.data(timestamp, column1, column2, column3) values(1710494862, "hello2", "explain2", "analyze2") insert into root.explain.analyze.data(timestamp, column1, column2, column3) values(1710494962, "hello3", "explain3", "analyze3") + +# 执行explain analyze语句 explain analyze select column2 from root.explain.analyze.data order by column1 ``` + 得到输出如下: -``` + +```Plain +-------------------------------------------------------------------------------------------------+ | Explain Analyze| +-------------------------------------------------------------------------------------------------+ @@ -155,15 +185,10 @@ explain analyze select column2 from root.explain.analyze.data order by column1 | SeriesPath: root.explain.analyze.data.column1 | +-------------------------------------------------------------------------------------------------+ ``` -##### EXPLAIN ANALYZE分析结果中的算子压缩 - +触发合并后的部分结果示例如下: -在Fragment中会输出当前节点中执行的所有节点信息,然而当一次查询涉及的序列过多时,每个节点都被输出会导致Explain Analyze返回的结果集过大,因此当相同类型的节点超过10个时,会合并当前Fragment下所有相同类型的节点。合并后统计信息也被累积,对于一些无法合并的定制信息会直接丢弃。 - -可以通过修改iotdb-system.properties中的配置项`merge_threshold_of_explain_analyze`来设置触发合并的节点阈值,该参数支持热加载。下面是一个触发合并后的部分结果示例: - -``` +```Plain Analyze Cost: 143.679 ms Fetch Partition Cost: 22.023 ms Fetch Schema Cost: 63.086 ms @@ -230,8 +255,74 @@ FRAGMENT-INSTANCE[Id: 20240311_041502_00001_1.3.0][IP: 192.168.130.9][DataRegion ...... ``` -##### 查询超时处理 +### 常见问题 + +#### WALL TIME(墙上时间)和 CPU TIME(CPU时间)的区别? + +CPU 时间也称为处理器时间或处理器使用时间,指的是程序在执行过程中实际占用 CPU 进行计算的时间,显示的是程序实际消耗的处理器资源。 + +墙上时间也称为实际时间或物理时间,指的是从程序开始执行到程序结束的总时间,包括了所有等待时间。 + +1. WALL TIME < CPU TIME 的场景:比如一个查询分片最后被调度器使用两个线程并行执行,真实物理世界上是 10s 过去了,但两个线程,可能一直占了两个 cpu 核跑了 10s,那 cpu time 就是 20s,wall time就是 10s +2. WALL TIME > CPU TIME 的场景:因为系统内可能会存在多个查询并行执行,但查询的执行线程数和内存是固定的, + 1. 所以当查询分片被某些资源阻塞住时(比如没有足够的内存进行数据传输、或等待上游数据)就会放入Blocked Queue,此时查询分片并不会占用 CPU TIME,但WALL TIME(真实物理时间的时间)是在向前流逝的 + 2. 或者当查询线程资源不足时,比如当前共有16个查询线程,但系统内并发有20个查询分片,即使所有查询都没有被阻塞,也只会同时并行运行16个查询分片,另外四个会被放入 READY QUEUE,等待被调度执行,此时查询分片并不会占用 CPU TIME,但WALL TIME(真实物理时间的时间)是在向前流逝的 + +#### Explain Analyze 是否有额外开销,测出的耗时是否与查询真实执行时有差别? + +几乎没有,因为 explain analyze operator 是单独的线程执行,收集原查询的统计信息,且这些统计信息,即使不explain analyze,原来的查询也会生成,只是没有人去取。并且 explain analyze 是纯 next 遍历结果集,不会打印,所以与原来查询真实执行时的耗时不会有显著差别。 + +#### IO 耗时主要关注几个指标? + +可能涉及 IO 耗时的主要有个指标,loadTimeSeriesMetadataDiskSeqTime, loadTimeSeriesMetadataDiskUnSeqTime 以及 construct[NonAligned/Aligned]ChunkReadersDiskTime + +TimeSeriesMetadata 的加载分别统计了顺序和乱序文件,但 Chunk 的读取暂时未分开统计,但顺乱序比例可以通过TimeseriesMetadata 顺乱序的比例计算出来。 + +#### 乱序数据对查询性能的影响能否有一些指标展示出来? + +乱序数据产生的影响主要有两个: + +1. 需要在内存中多做一个归并排序(一般认为这个耗时是比较短的,毕竟是纯内存的 cpu 操作) +2. 乱序数据会产生数据块间的时间范围重叠,导致统计信息无法使用 + 1. 无法利用统计信息直接 skip 掉整个不满足值过滤要求的 chunk + 1. 一般用户的查询都是只包含时间过滤条件,则不会有影响 + 2. 无法利用统计信息直接计算出聚合值,无需读取数据 + +单独对于乱序数据的性能影响,目前并没有有效的观测手段,除非就是在有乱序数据的时候,执行一遍查询耗时,然后等乱序合完了,再执行一遍,才能对比出来。 + +因为即使乱序这部分数据进了顺序,也是需要 IO、加压缩、decode,这个耗时少不了,不会因为乱序数据被合并进乱序了,就减少了。 + +#### 执行 explain analyze 时,查询超时后,为什么结果没有输出在 log_explain_analyze.log 中? + +升级时,只替换了 lib 包,没有替换 conf/logback-datanode.xml,需要替换一下 conf/logback-datanode.xml,然后不需要重启(该文件内容可以被热加载),大约等待 1 分钟后,重新执行 explain analyze verbose。 + +### 实战案例 + +#### 案例一:查询涉及文件数量过多,磁盘IO成为瓶颈,导致查询速度变慢 + + + +查询总耗时为 938 ms,其中从文件中读取索引区和数据区的耗时占据 918 ms,涉及了总共 289 个文件,假设查询涉及 N 个 TsFile,磁盘单次 seek 耗时为 t_seek,读取文件尾部索引的耗时为 t_index,读取文件的数据块的耗时为 t_chunk,则首次查询(未命中缓存)的理论耗时为 `cost = N * (t_seek + t_index + t_seek + t_chunk)`,按经验值,HDD 磁盘的一次 seek 耗时约为 5-10ms,所以查询涉及的文件数越多,查询延迟会越大。 + +最终优化方案为: + +1. 调整合并参数,降低文件数量 +2. 更换 HDD 为 SSD,降低磁盘单次 IO 的延迟 + +#### 案例二:like 谓词执行慢导致查询超时 + +执行如下 sql 时,查询超时(默认超时时间为 60s) + +```SQL +select count(s1) as total from root.db.d1 where s1 like '%XXXXXXXX%' +``` + +执行 explain analyze verbose 时,即使查询超时,也会每隔 15s,将阶段性的采集结果输出到 log_explain_analyze.log 中,从 log_explain_analyze.log 中得到最后两次的输出结果如下: + + + + -Explain Analyze本身是一种特殊的查询,当执行超时的时候,我们是无法从返回结果中获得分析结果的。为了处理该情况,使得在超时的情况下也可以通过分析结果排查超时原因,Explain Analyze提供了**定时日志**机制,每经过一定的时间间隔会将Explain Analyze的当前结果以文本的形式输出到专门的日志中。这样当查询超时时,就可以前往logs中查看对应的日志进行排查。 +观察结果,我们发现是因为查询未加时间条件,涉及的数据太多 constructAlignedChunkReadersDiskTime 和 pageReadersDecodeAlignedDiskTime的耗时一直在涨,意味着一直在读新的 chunk。但 AlignedSeriesScanNode 的输出信息一直是 0,这是因为算子只有在输出至少一行满足条件的数据时,才会让出时间片,并更新信息。从总的读取耗时(loadTimeSeriesMetadataAlignedDiskSeqTime + loadTimeSeriesMetadataAlignedDiskUnSeqTime + constructAlignedChunkReadersDiskTime + pageReadersDecodeAlignedDiskTime=约13.4秒)来看,其他耗时(60s - 13.4 = 46.6)应该都是在执行过滤条件上(like 谓词的执行很耗时)。 -日志的时间间隔基于查询的超时时间进行计算,可以保证在超时的情况下至少会有两次的结果记录。 \ No newline at end of file +最终优化方案为:增加时间过滤条件,避免全表扫描 \ No newline at end of file