This is an automated email from the ASF dual-hosted git repository.

jackietien pushed a commit to branch main
in repository https://gitbox.apache.org/repos/asf/iotdb-docs.git
The following commit(s) were added to refs/heads/main by this push:
new df713b1 Fix English benchmark image
df713b1 is described below
commit df713b18f17860f9b3466c0af0e59e316ada1218
Author: W1y1r <[email protected]>
AuthorDate: Thu Aug 15 19:38:36 2024 +0800
Fix English benchmark image
---
src/UserGuide/Master/Tools-System/Benchmark.md | 38 ++++++++++++++++----------
src/UserGuide/V1.2.x/Tools-System/Benchmark.md | 7 +++--
src/UserGuide/latest/Tools-System/Benchmark.md | 6 ++--
3 files changed, 33 insertions(+), 18 deletions(-)
diff --git a/src/UserGuide/Master/Tools-System/Benchmark.md
b/src/UserGuide/Master/Tools-System/Benchmark.md
index 8f88659..c765100 100644
--- a/src/UserGuide/Master/Tools-System/Benchmark.md
+++ b/src/UserGuide/Master/Tools-System/Benchmark.md
@@ -25,13 +25,15 @@ IoT-benchmark is a time-series database benchmarking tool
based on Java and big
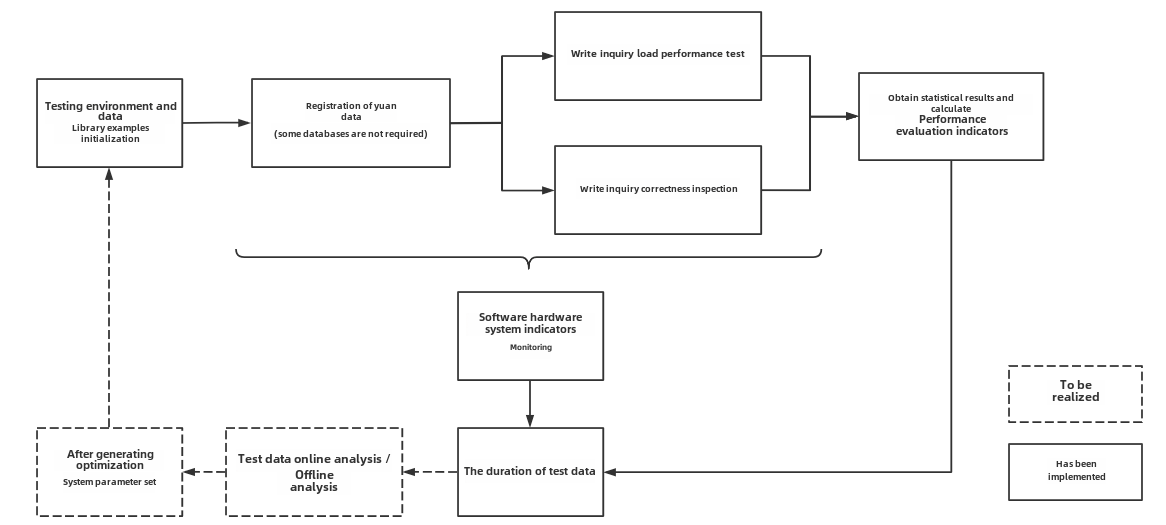
Figure 1-1 below includes the test benchmark process and other extended
functions. These processes can be unified by IoT-benchmark. IoT Benchmark
supports a variety of workloads, including **pure write, pure query, write
query mixed**, etc., supports **software and hardware system monitoring, test
metric measurement** and other monitoring functions, and also realizes
**initializing the database automatically, test data analysis and system
parameter optimization** functions.
-
+
+
Figure 1-1
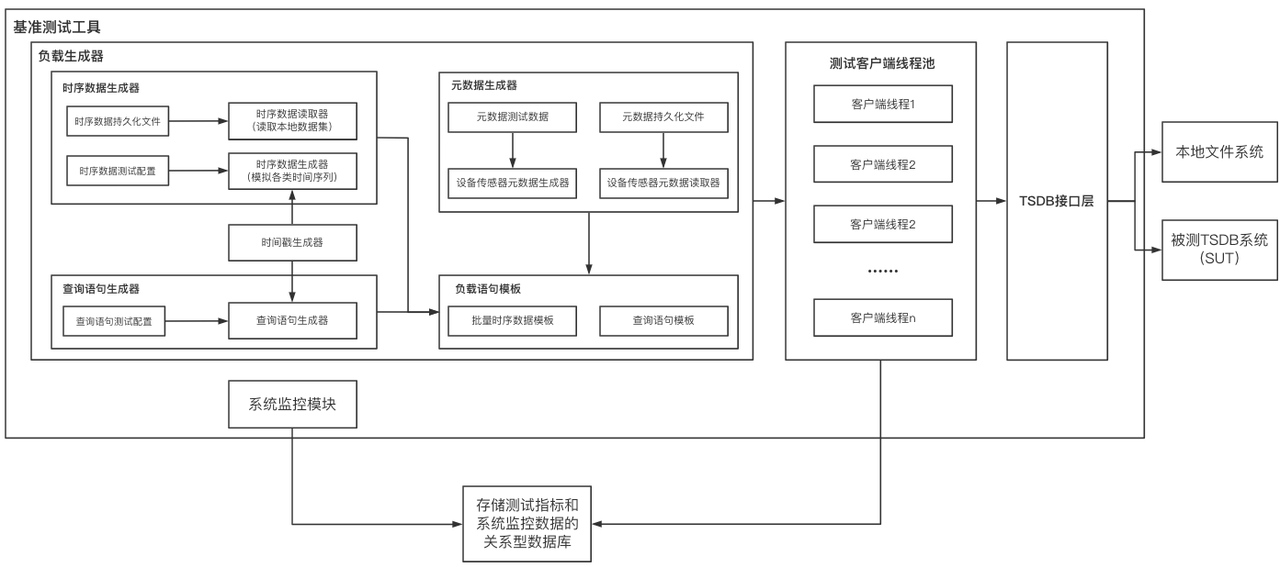
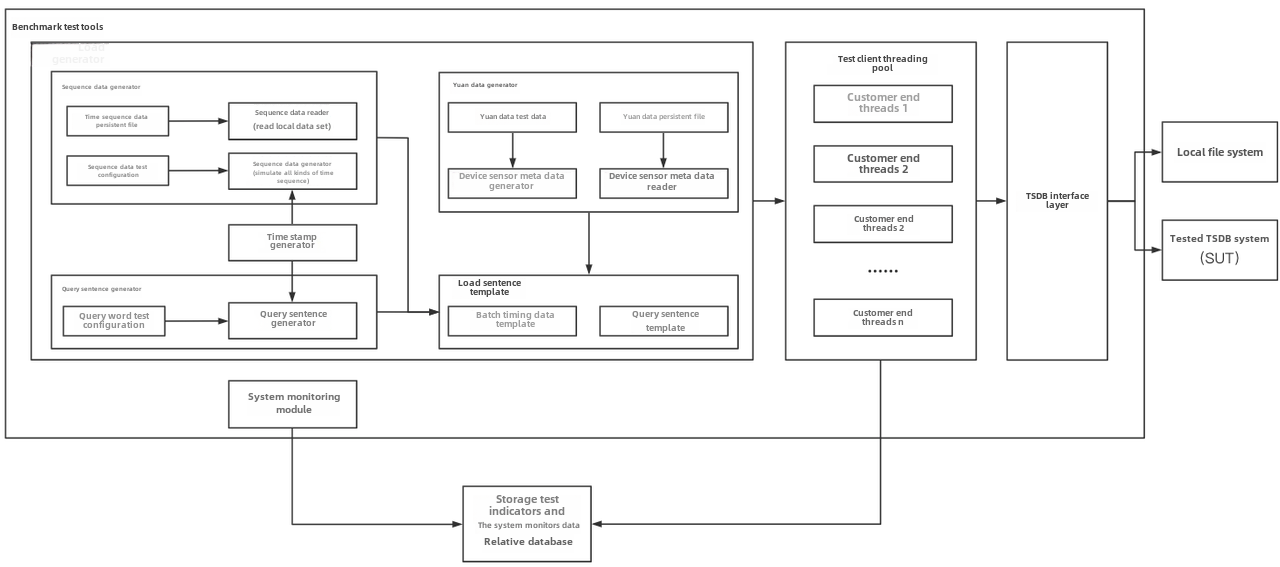
Referring to the YCSB test tool's design idea of separating the three
components of workload generation, performance metric measurement and database
interface, the modular design of IoT-benchmark is shown in Figure 1-2.
Different from the YCSB-based test tool system, IoT-benchmark adds a system
monitoring module to support the persistence of test data and system monitoring
data. In addition, some special load testing functions especially designed for
time series data scenarios have been [...]
-
+
+
Figure 1-2
@@ -69,7 +71,8 @@ Table 1-1 Comparison of big data test benchmarks
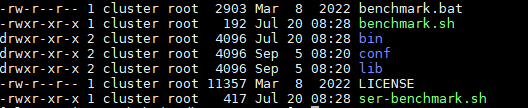
The directory structure of the test package is shown in Figure 1-3 below. The
test configuration file is conf/config.properties, and the test startup scripts
are benchmark\.sh (Linux & MacOS) and benchmark.bat (Windows). The detailed
usage of the files is shown in Table 1-2.
-
+
+
Figure 1-3 List of files and folders
@@ -97,7 +100,8 @@ Table 1-2 Usage list of files and folders
All the log files of the test are stored in the logs folder, and the test
results are stored in the data/csvOutput folder after the test is completed.
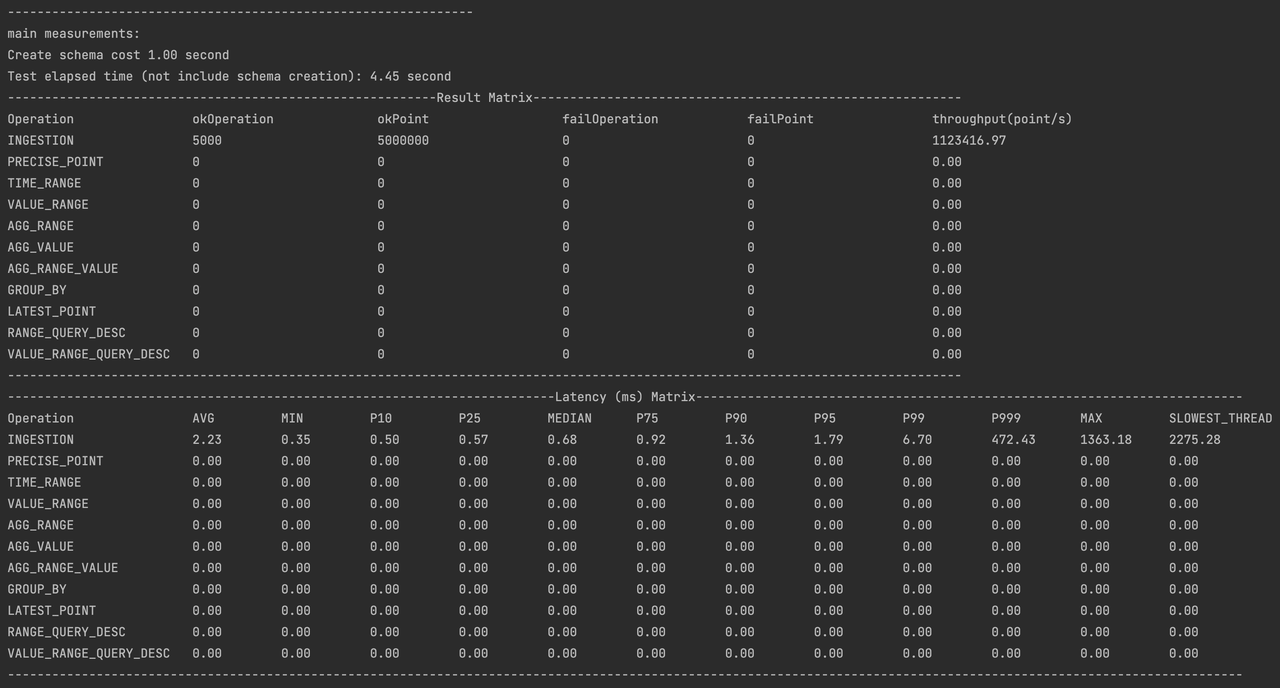
For example, after the test, we get the following result matrix:
-
+
+
- Result Matrix
- OkOperation: successful operations
@@ -251,24 +255,27 @@ Table 2-3 Configuration parameter information
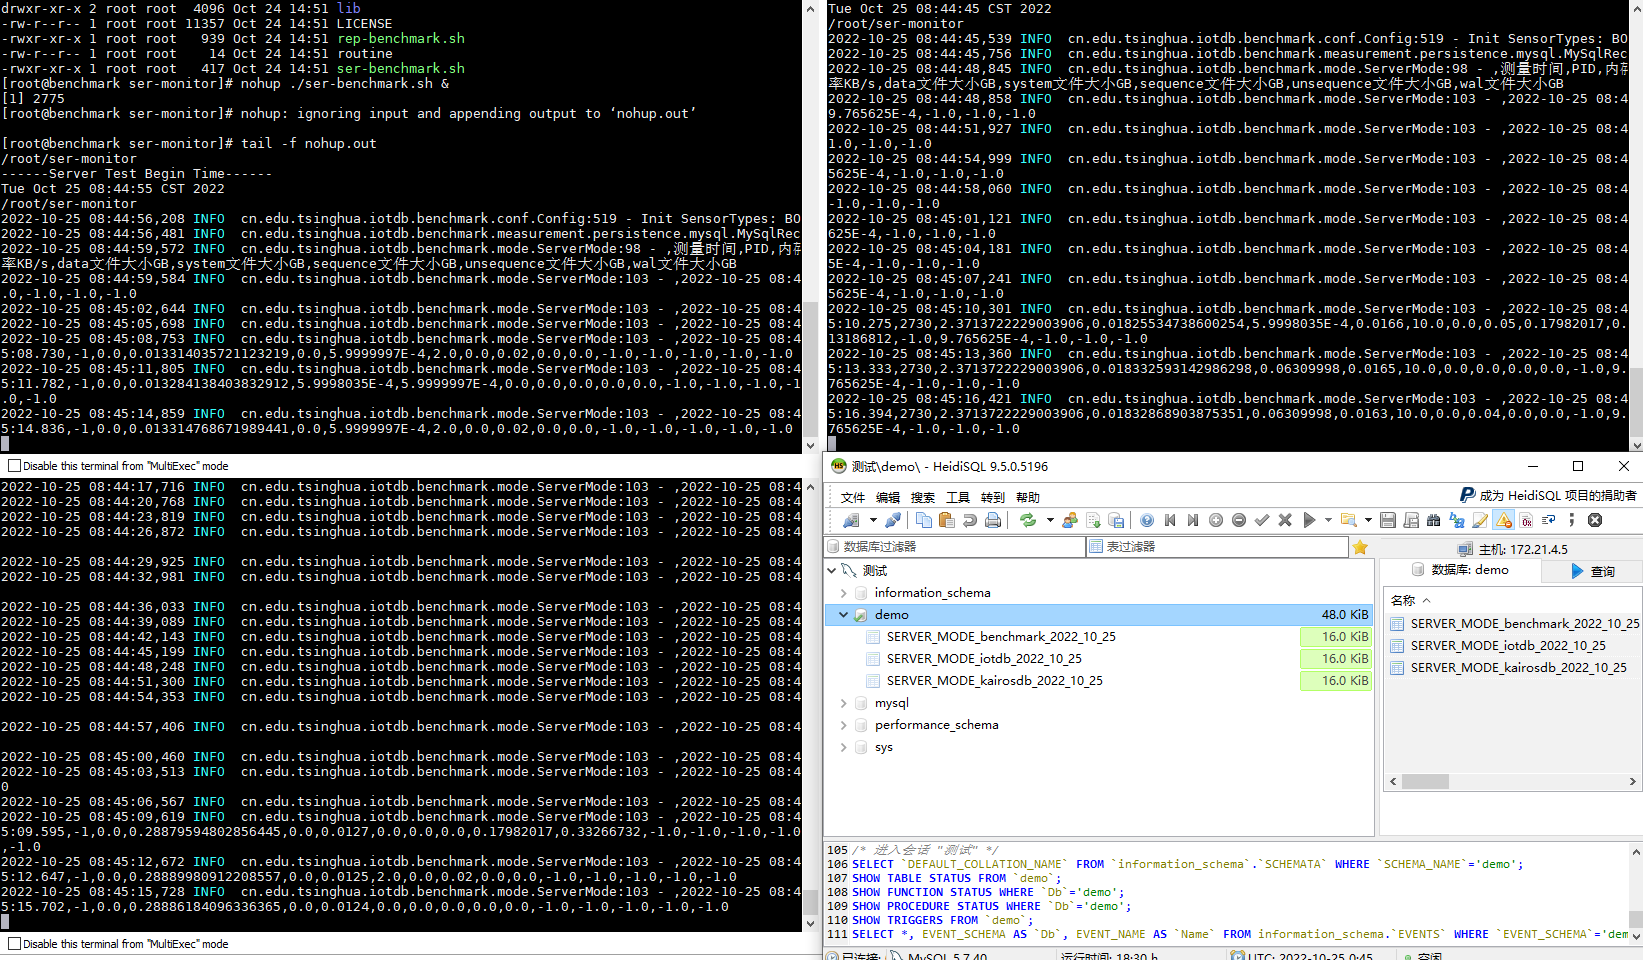
First, start the tested time series databases Apache-IoTDB and KairosDB on
172.21.4.3 and 172.21.4.4 respectively, and then start server resource
monitoring through the ser-benchamrk\.sh script on 172.21.4.2, 172.21.4.3 and
172.21.4.4 (Figure 2-1). Then modify the conf/config.properties files in the
iotdb-0.13-0.0.1 and kairosdb-0.0.1 folders in 172.21.4.2 according to Table
2-3 to meet the test requirements. Use benchmark\.sh to start the writing test
of Apache-IoTDB and KairosDB successively.
-
+
+
Figure 2-1 Server monitoring tasks
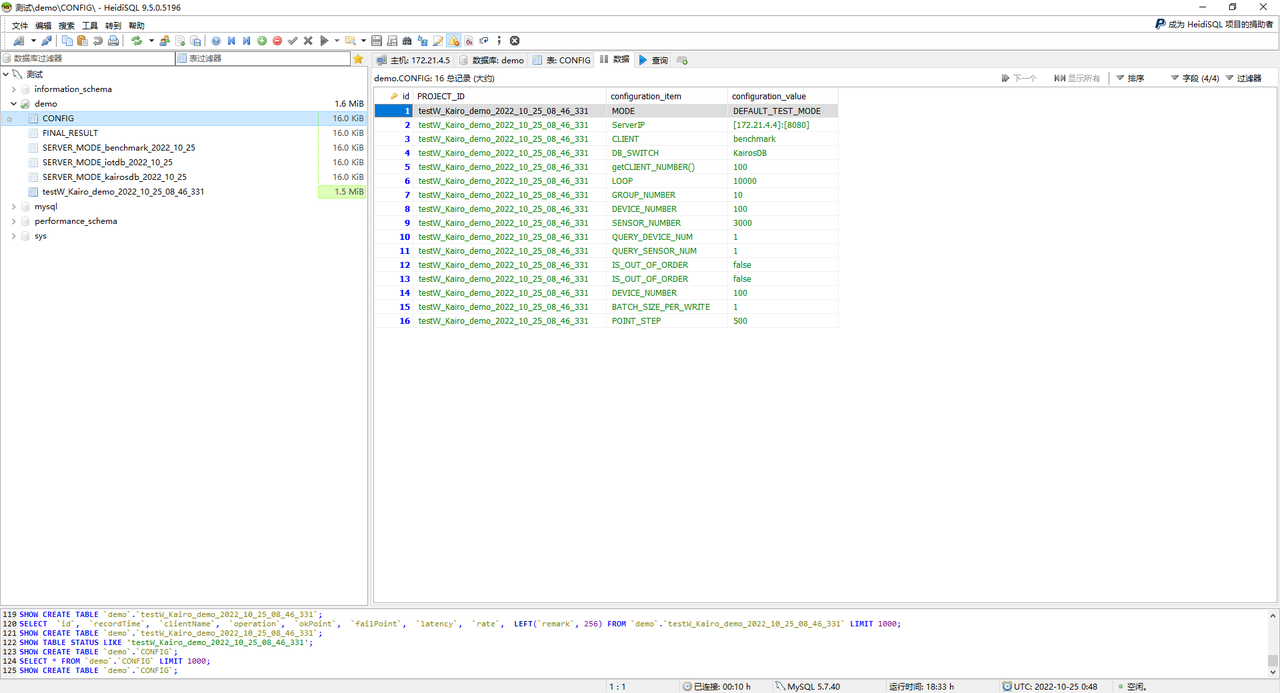
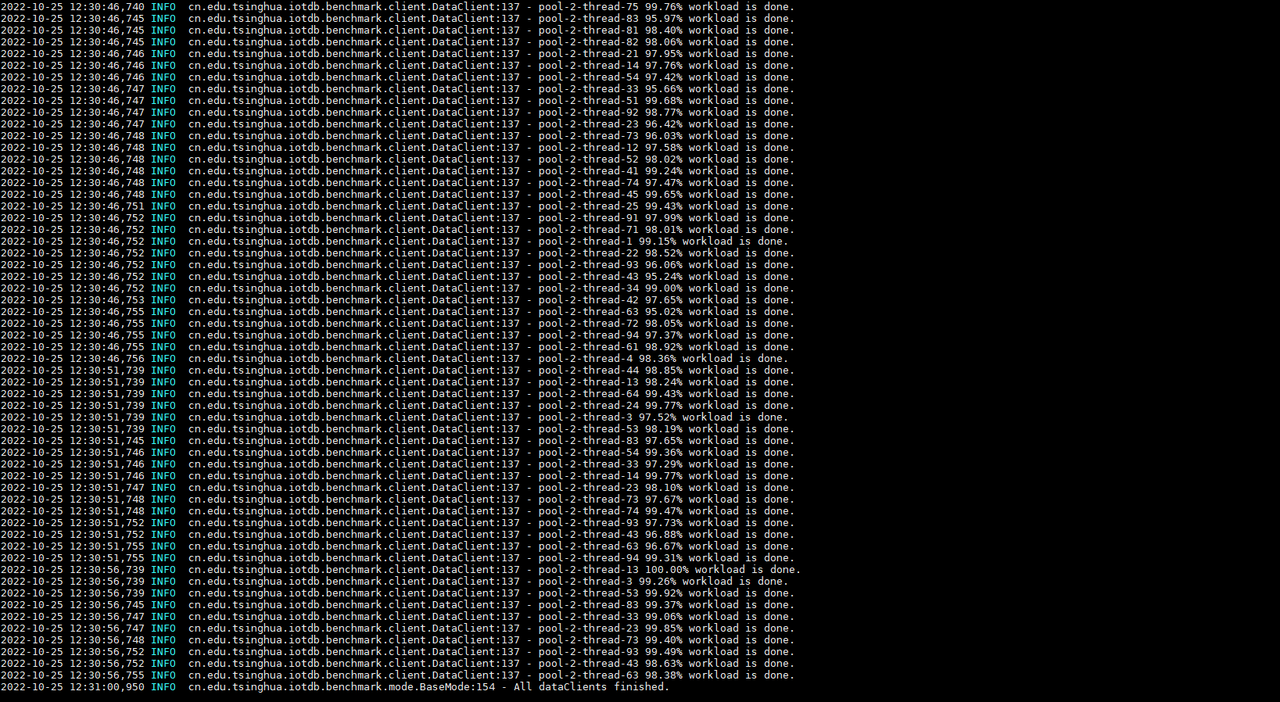
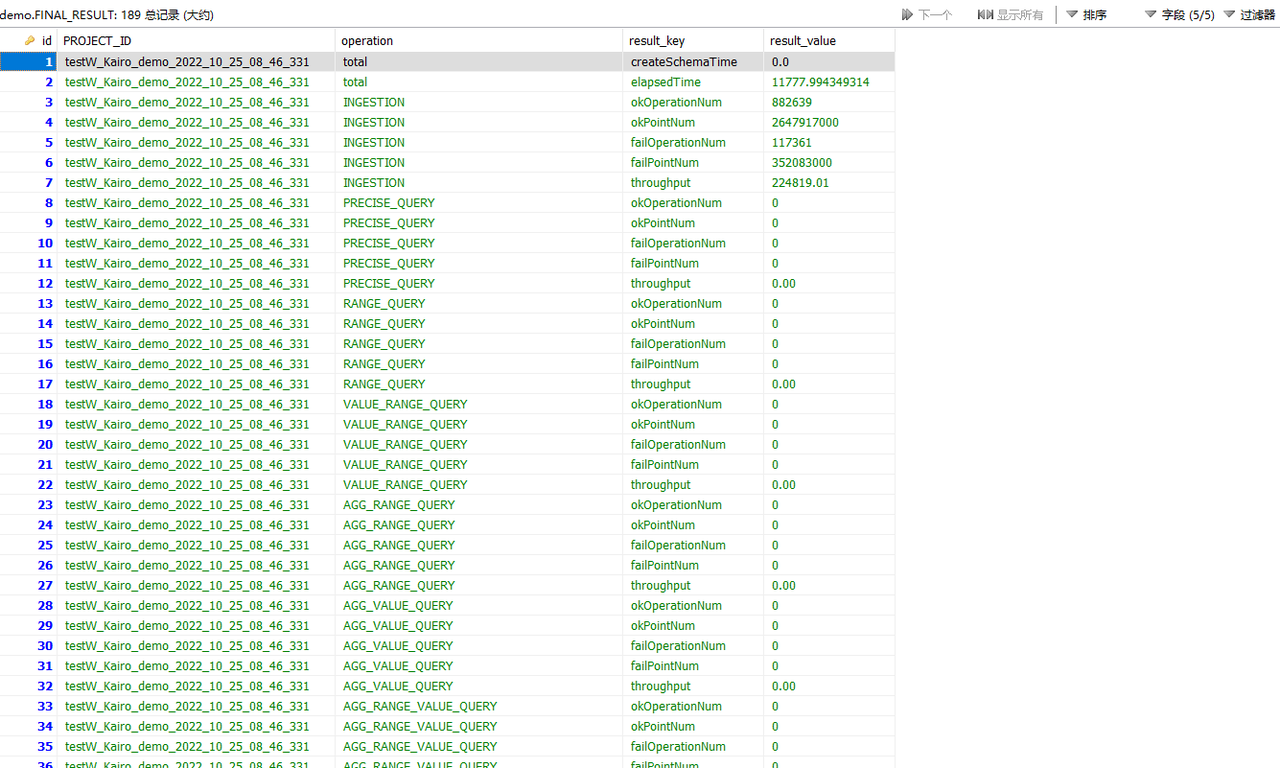
For example, if we first start the test on KairosDB, IoT-benchmark will create
a CONFIG data table in the MySQL database to store the configuration
information of this test (Figure 2-2), and there will be a log output of the
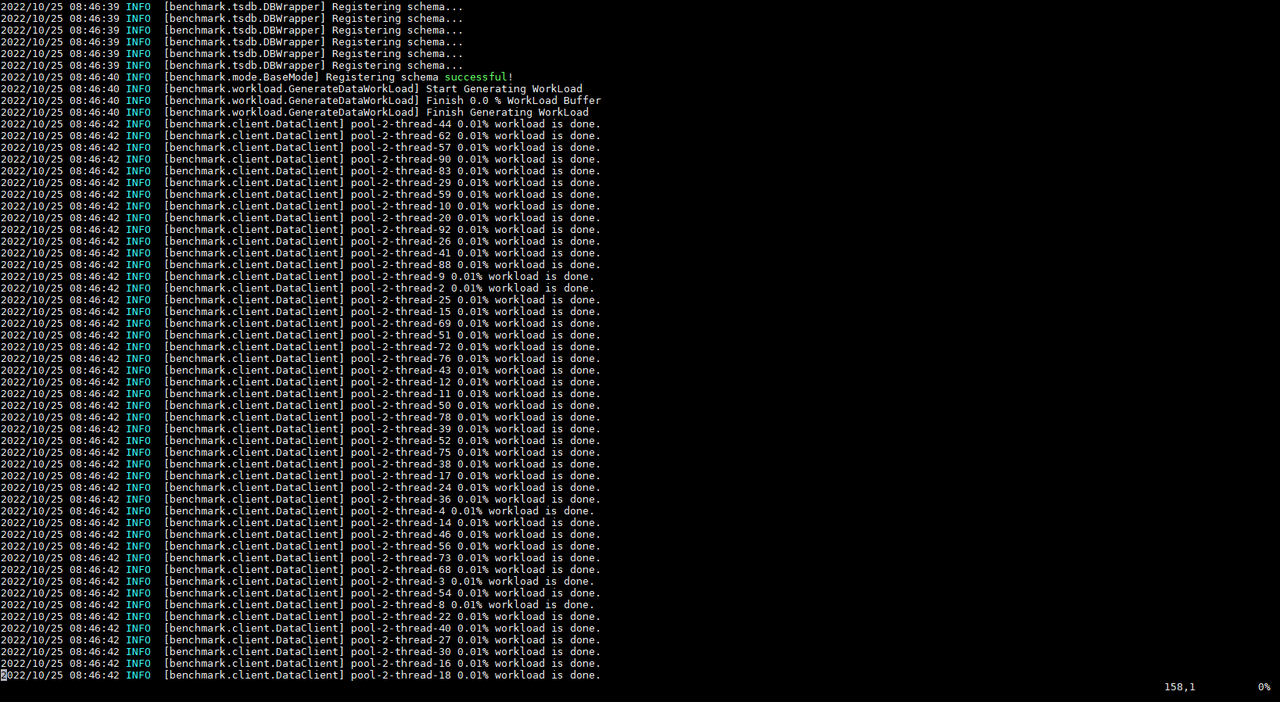
current test progress during the test execution (Figure 2-3) . When the test is
completed, the test result will be output (Figure 2-3), and the result will be
written into the FINAL_RESULT data table (Figure 2-4).
-
+
Figure 2-2 Test configuration information table
-
-
-
-
+
+
+
+
Figure 2-3 Test progress and results
-
+
+
+
Figure 2-4 Test result table
@@ -276,14 +283,17 @@ Afterwards, we will start the test on Apache-IoTDB. The
same IoT-benchmark will
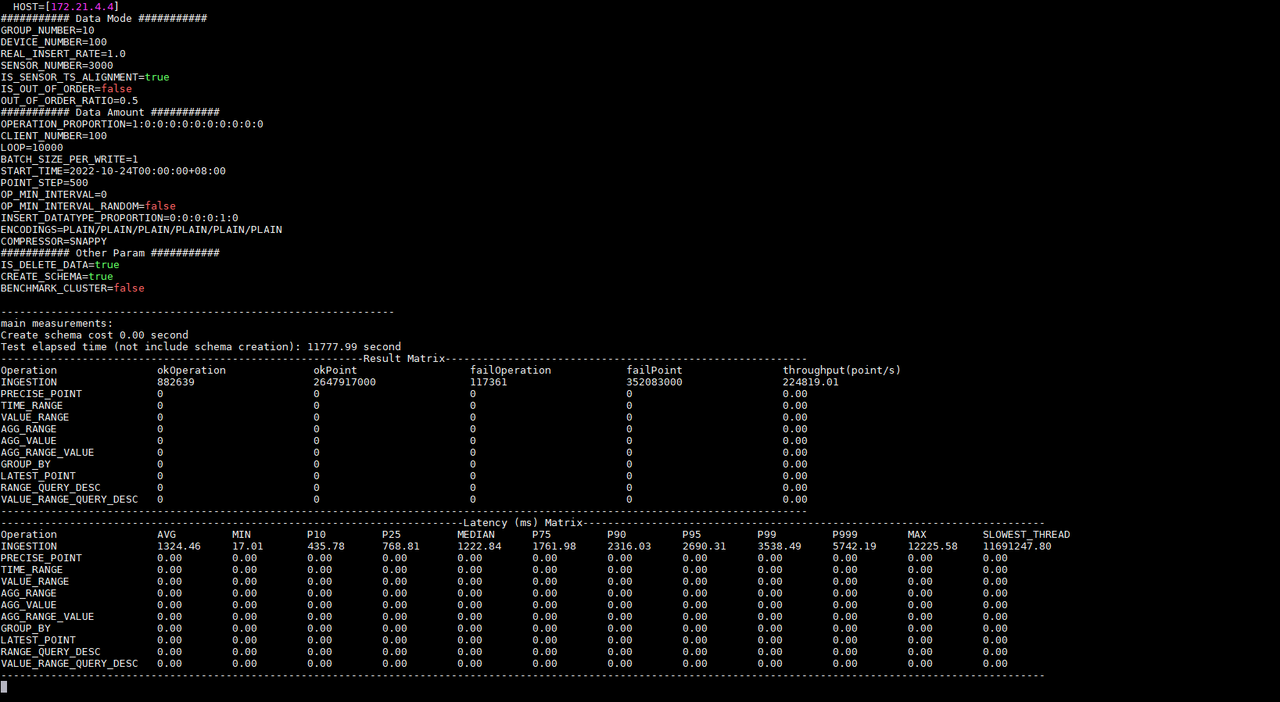
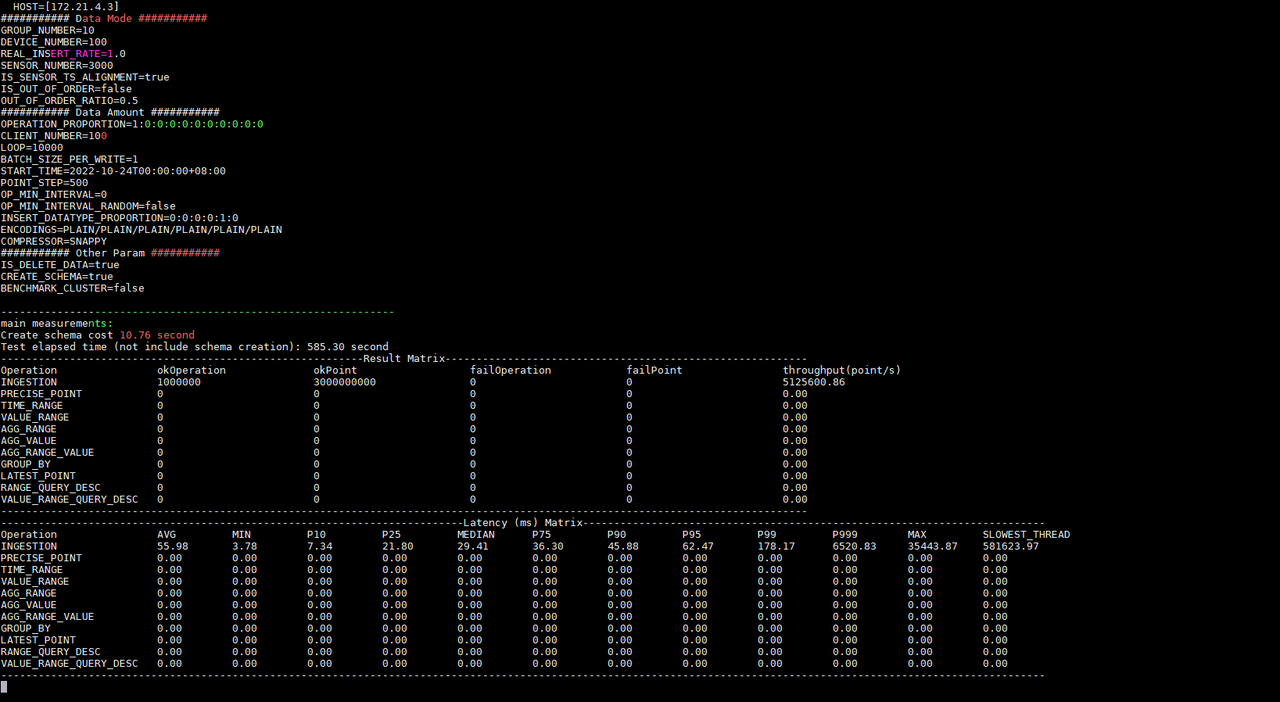
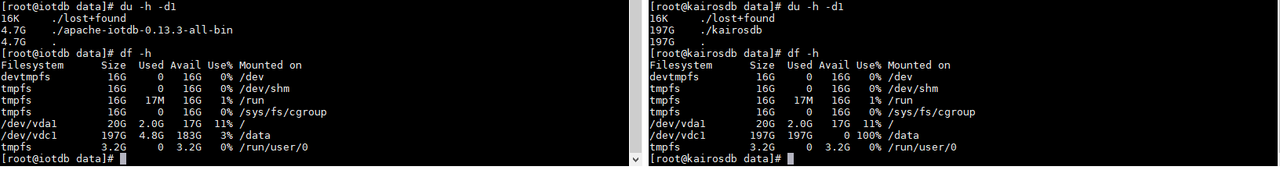
According to the test result information, we know that under the same
configuration the write delay times of Apache-IoTDB and KairosDB are 55.98ms
and 1324.45ms respectively; the write throughputs are 5,125,600.86
points/second and 224,819.01 points/second respectively; the tests were
executed respectively 585.30 seconds and 11777.99 seconds. And KairosDB has a
write failure. After investigation, it is found that the data disk usage has
reached 100%, and there is no disk space to continu [...]
-
+
+
Figure 2-5 Disk usage
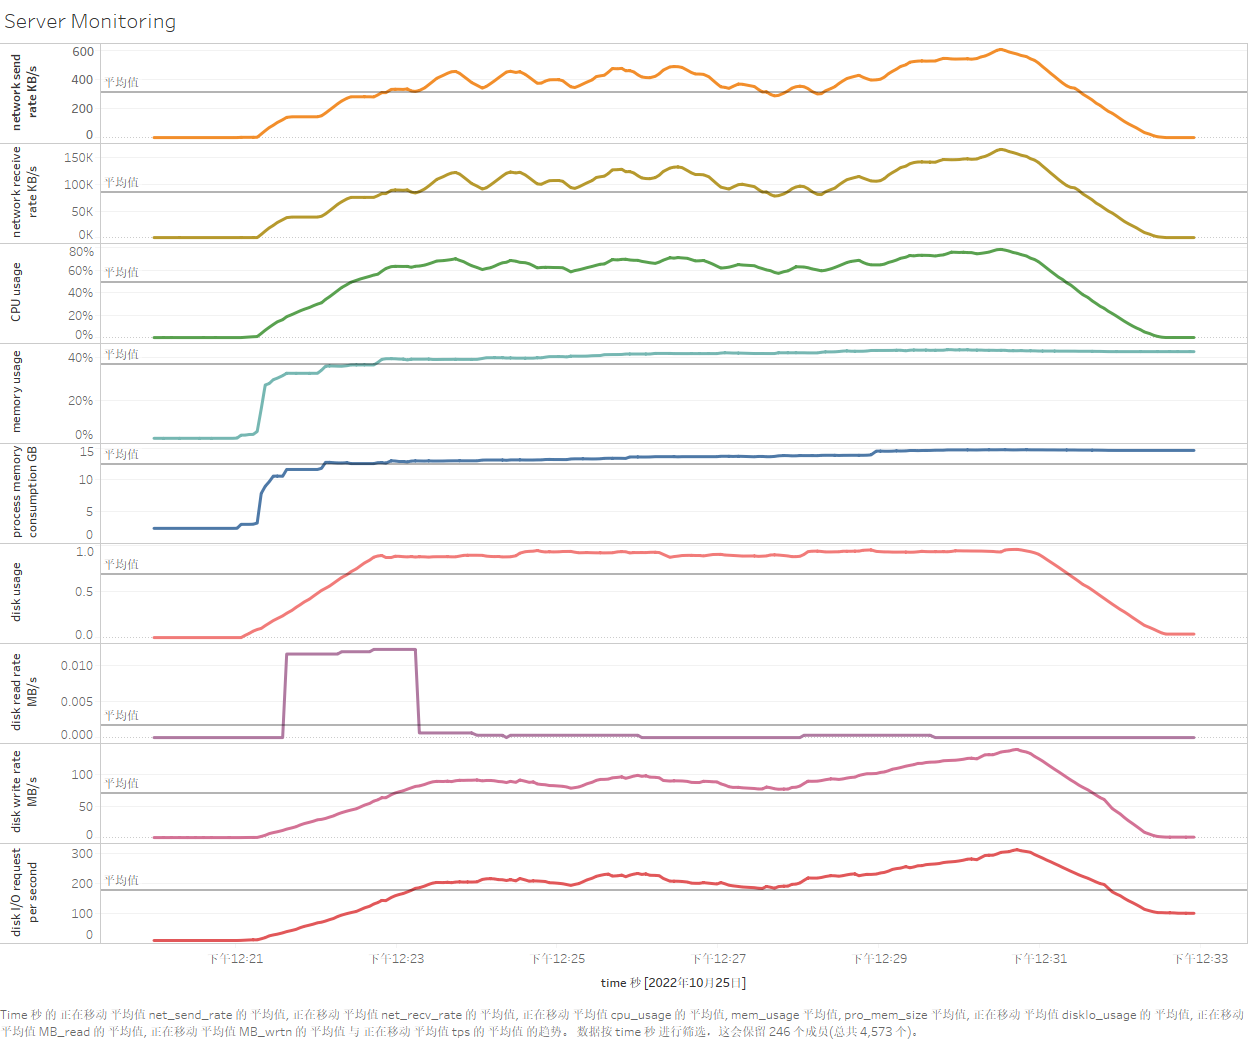
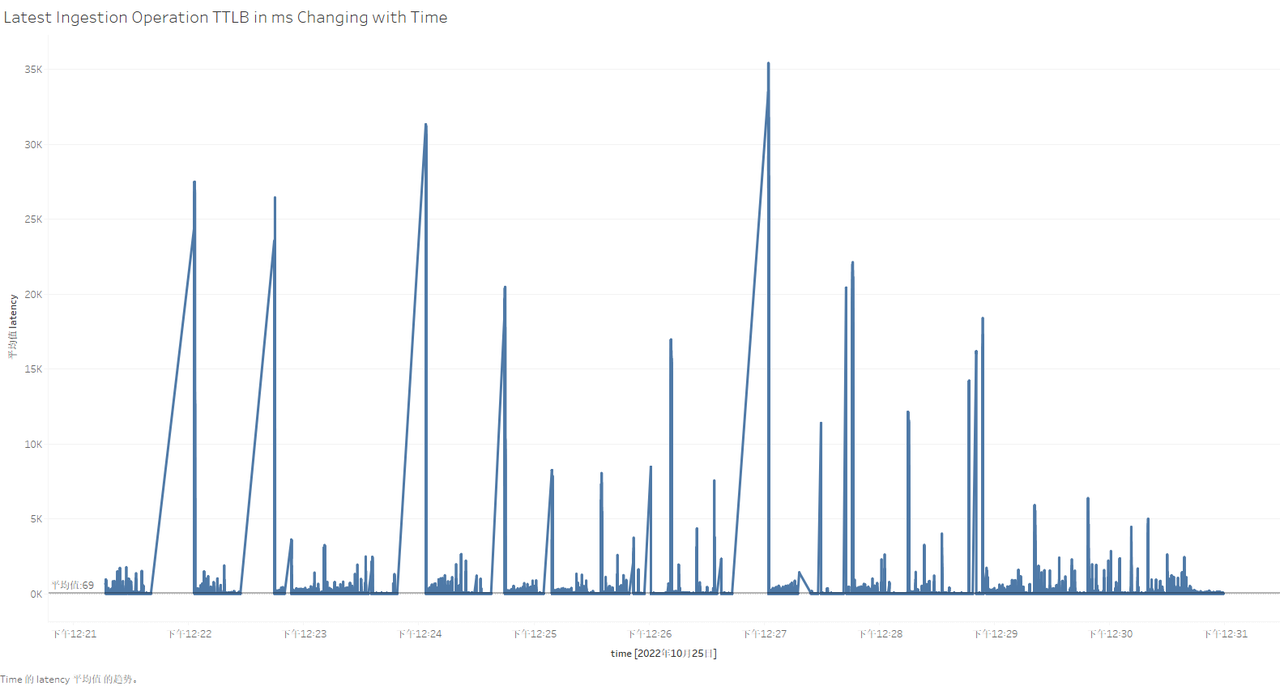
So what is the resource usage of each server during the test? What is the
specific performance of each write operation? At this time, we can visualize
the data in the server monitoring table and test process recording table by
installing and using Tableau. The use of Tableau will not be introduced in this
article. After connecting to the data table for test data persistence, the
specific results are as follows (taking Apache-IoTDB as an example):
-
-
+
+
+
+
Figure 2-6 Visualization of testing process in Tableau
diff --git a/src/UserGuide/V1.2.x/Tools-System/Benchmark.md
b/src/UserGuide/V1.2.x/Tools-System/Benchmark.md
index a7f75cd..43f9b43 100644
--- a/src/UserGuide/V1.2.x/Tools-System/Benchmark.md
+++ b/src/UserGuide/V1.2.x/Tools-System/Benchmark.md
@@ -25,13 +25,16 @@ IoT-benchmark is a time-series database benchmarking tool
based on Java and big
Figure 1-1 below includes the test benchmark process and other extended
functions. These processes can be unified by IoT-benchmark. IoT Benchmark
supports a variety of workloads, including **pure write, pure query, write
query mixed**, etc., supports **software and hardware system monitoring, test
metric measurement** and other monitoring functions, and also realizes
**initializing the database automatically, test data analysis and system
parameter optimization** functions.
-
+
+
Figure 1-1
Referring to the YCSB test tool's design idea of separating the three
components of workload generation, performance metric measurement and database
interface, the modular design of IoT-benchmark is shown in Figure 1-2.
Different from the YCSB-based test tool system, IoT-benchmark adds a system
monitoring module to support the persistence of test data and system monitoring
data. In addition, some special load testing functions especially designed for
time series data scenarios have been [...]
-
+
+
+
Figure 1-2
diff --git a/src/UserGuide/latest/Tools-System/Benchmark.md
b/src/UserGuide/latest/Tools-System/Benchmark.md
index 8f88659..dd48d84 100644
--- a/src/UserGuide/latest/Tools-System/Benchmark.md
+++ b/src/UserGuide/latest/Tools-System/Benchmark.md
@@ -25,13 +25,15 @@ IoT-benchmark is a time-series database benchmarking tool
based on Java and big
Figure 1-1 below includes the test benchmark process and other extended
functions. These processes can be unified by IoT-benchmark. IoT Benchmark
supports a variety of workloads, including **pure write, pure query, write
query mixed**, etc., supports **software and hardware system monitoring, test
metric measurement** and other monitoring functions, and also realizes
**initializing the database automatically, test data analysis and system
parameter optimization** functions.
-
+
+
Figure 1-1
Referring to the YCSB test tool's design idea of separating the three
components of workload generation, performance metric measurement and database
interface, the modular design of IoT-benchmark is shown in Figure 1-2.
Different from the YCSB-based test tool system, IoT-benchmark adds a system
monitoring module to support the persistence of test data and system monitoring
data. In addition, some special load testing functions especially designed for
time series data scenarios have been [...]
-
+
+
Figure 1-2