This is an automated email from the ASF dual-hosted git repository.

zhaoxinyi pushed a commit to branch main
in repository https://gitbox.apache.org/repos/asf/iotdb-docs.git
The following commit(s) were added to refs/heads/main by this push:
new 797b13a4 Update Workbench documentation (#389)
797b13a4 is described below
commit 797b13a4f954f04af48d8a870fc53399fcf23628
Author: majialin <[email protected]>
AuthorDate: Fri Oct 25 16:51:54 2024 +0800
Update Workbench documentation (#389)
---
.../workbench-deployment.md | 53 ++++----------
.../workbench-deployment.md | 80 +++++-----------------
2 files changed, 33 insertions(+), 100 deletions(-)
diff --git
a/src/UserGuide/Master/Deployment-and-Maintenance/workbench-deployment.md
b/src/UserGuide/Master/Deployment-and-Maintenance/workbench-deployment.md
index 5364371c..08072122 100644
--- a/src/UserGuide/Master/Deployment-and-Maintenance/workbench-deployment.md
+++ b/src/UserGuide/Master/Deployment-and-Maintenance/workbench-deployment.md
@@ -53,45 +53,45 @@ The visualization console is one of the supporting tools
for IoTDB. It is an off
<tr>
<td>cn_metric_reporter_list</td>
<td rowspan="3">conf/iotdb-system.properties</td>
- <td>Uncomment the configuration item and set the value to
PROMETHEUS</td>
+ <td>Please add this configuration item to the configuration
file and set the value to PROMETHEUS</td>
</tr>
<tr>
<td>cn_metric_level</td>
- <td>Uncomment the configuration item and set the value to
IMPORTANT</td>
+ <td>Please add this configuration item to the configuration
file and set the value to IMPORTANT</td>
</tr>
<tr>
<td>cn_metric_prometheus_reporter_port</td>
- <td>Uncomment the configuration item to maintain the default
setting of 9091. If other ports are set, they will not conflict with each
other</td>
+ <td>Please add this configuration item to the configuration
file to maintain the default setting of 9091. If other ports are set, they will
not conflict with each other</td>
</tr>
<tr>
<td>dn_metric_reporter_list</td>
<td rowspan="4">conf/iotdb-system.properties</td>
- <td>Uncomment the configuration item and set the value to
PROMETHEUS</td>
+ <td>Please add this configuration item to the configuration
file and set the value to PROMETHEUS</td>
</tr>
<tr>
<td>dn_metric_level</td>
- <td>Uncomment the configuration item and set the value to
IMPORTANT</td>
+ <td>Please add this configuration item to the configuration
file and set the value to IMPORTANT</td>
</tr>
<tr>
<td>dn_metric_prometheus_reporter_port</td>
- <td>Uncomment the configuration item and set it to 9092 by
default. If other ports are set, they will not conflict with each other</td>
+ <td>Please add this configuration item to the configuration
file and set it to 9092 by default. If other ports are set, they will not
conflict with each other</td>
</tr>
<tr>
<td>dn_metric_internal_reporter_type</td>
- <td>Uncomment the configuration item and set the value to
IOTDB</td>
+ <td>Please add this configuration item to the configuration
file and set the value to IOTDB</td>
</tr>
<tr>
<td>enable_audit_log</td>
<td rowspan="3">conf/iotdb-system.properties</td>
- <td>Uncomment the configuration item and set the value to
true</td>
+ <td>Please add this configuration item to the configuration
file and set the value to true</td>
</tr>
<tr>
<td>audit_log_storage</td>
- <td>Uncomment configuration items</td>
+ <td>Please add this configuration item in the configuration
file, with values set to IOTDB and LOGGER</td>
</tr>
<tr>
<td>audit_log_operation</td>
- <td>Uncomment configuration items</td>
+ <td>Please add this configuration item in the configuration
file, with values set to DML,DDL,QUERY</td>
</tr>
</table>
@@ -156,8 +156,6 @@ The visualization console is one of the supporting tools
for IoTDB. It is an off
### Step 3: Install Workbench
-#### Windows:
-
1. Enter the config directory of iotdb Workbench -`<version>`
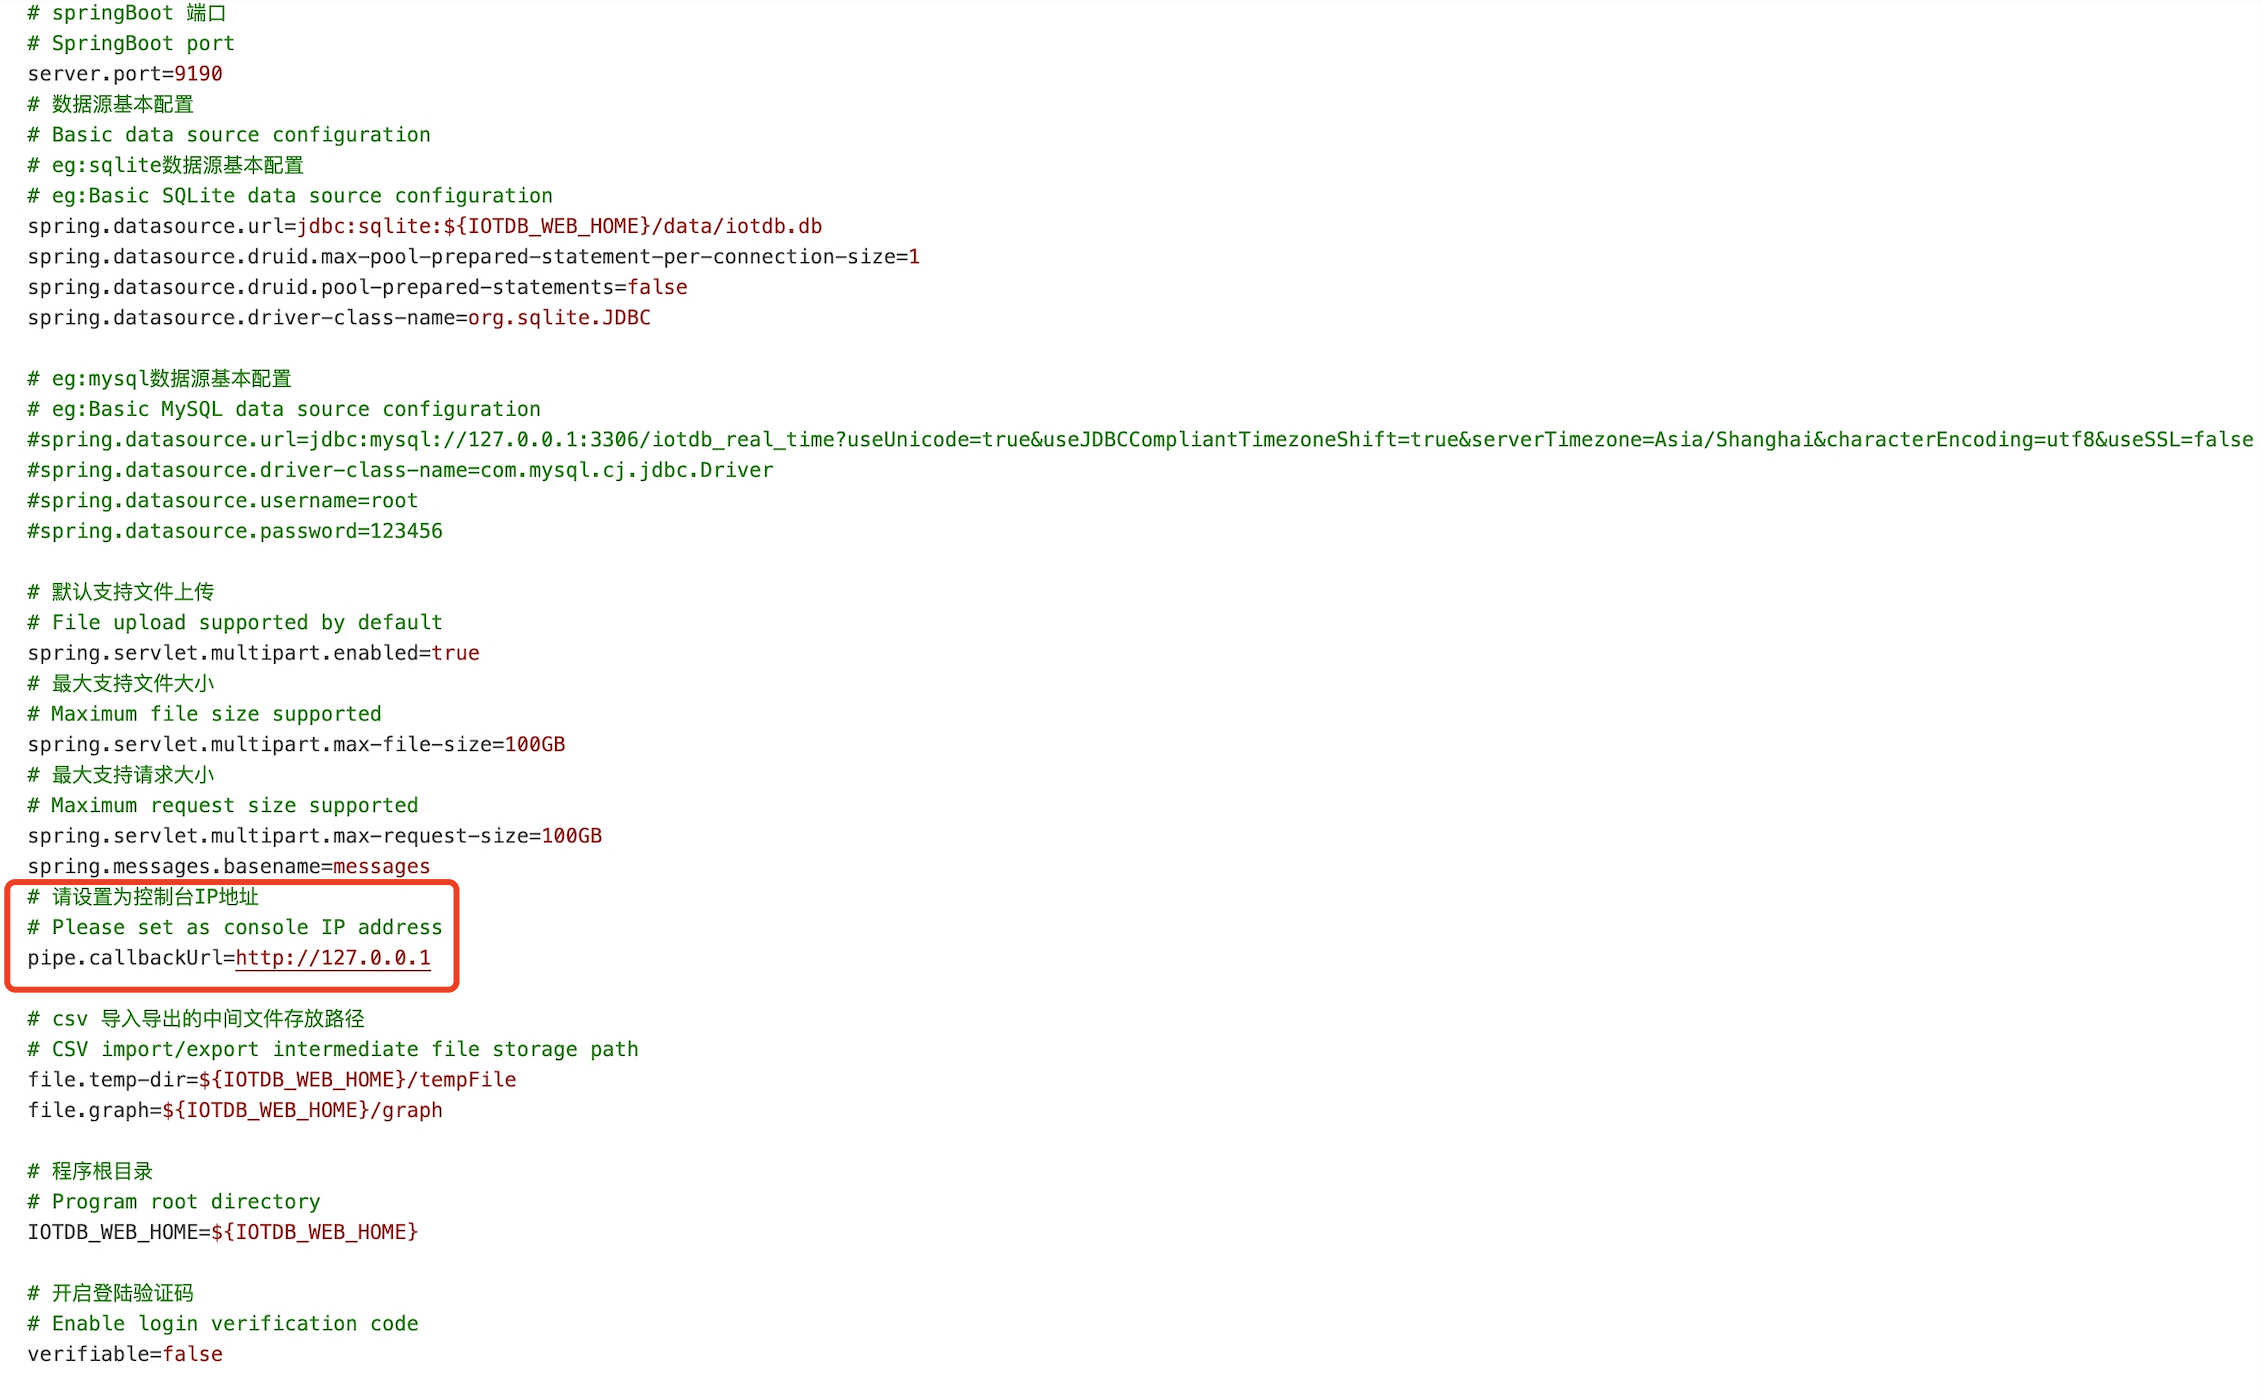
2. Modify Workbench configuration file: Go to the `config` folder and modify
the configuration file `application-prod.properties`. If you are installing it
locally, there is no need to modify it. If you are deploying it on a server,
you need to modify the IP address
@@ -170,48 +168,25 @@ The visualization console is one of the supporting tools
for IoTDB. It is an off
3. Startup program: Please execute the startup command in the sbin folder of
IoTDB Workbench -`<version>`
-
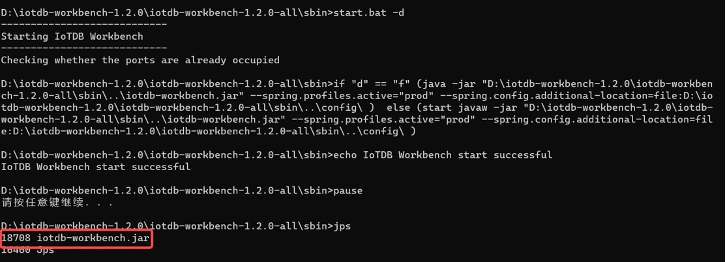
+ Windows:
```shell
# Start Workbench in the background
start.bat -d
```
-
-4. You can use the `jps` command to check if the startup was successful, as
shown in the figure:
-
- 
-
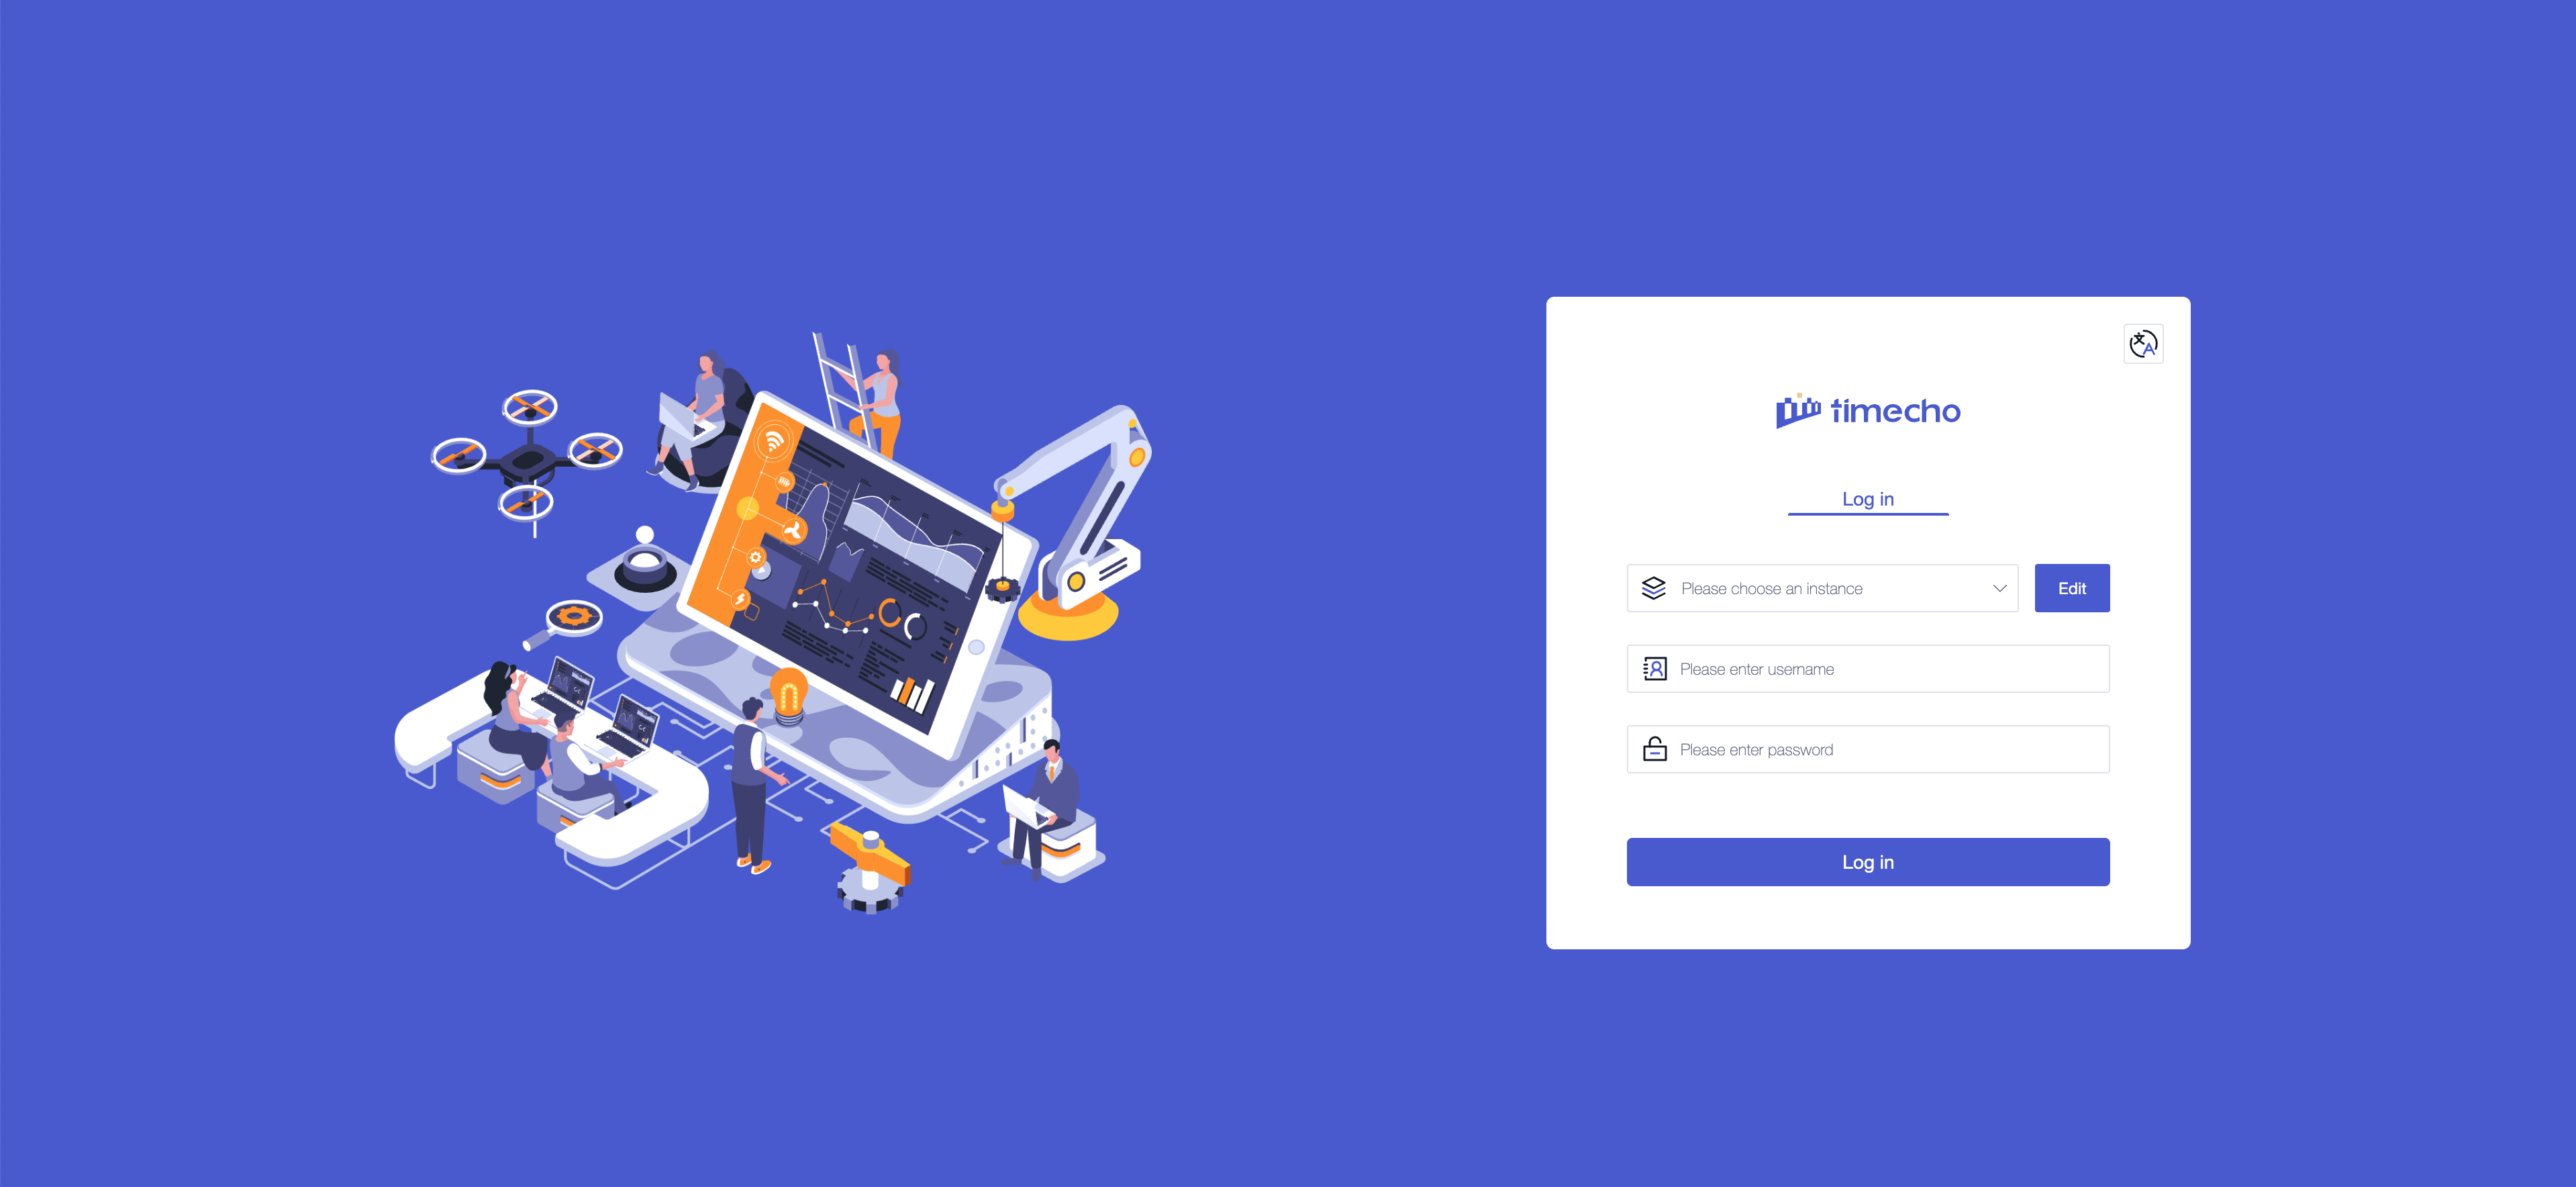
-5. Verification successful: Open "`http://Server IP: Port in configuration
file`" in the browser to access, for example:"`http://127.0.0.1:9190`"; When the
login interface appears, it is considered successful
-
- 
-
-#### Linux:
-
-1. Enter the IoTDB Workbench -`<version>` directory
-
-2. Modify Workbench configuration: Go to the `config` folder and modify the
configuration file `application-prod.properties`. If you are installing it
locally, there is no need to modify it. If you are deploying it on a server,
you need to modify the IP address
- > Workbench can be deployed on a local or cloud server as long as it can
connect to IoTDB
-
- | Configuration | Before Modification | After
modification |
- | ---------------- | ----------------------------------- |
----------------------------------------------- |
- | pipe.callbackUrl | pipe.callbackUrl=`http://127.0.0.1` |
pipe.callbackUrl=`http://<Workbench's IP address>` |
-
- 
-
-3. Startup program: Please execute the startup command in the sbin folder of
IoTDB Workbench -`<version>`
-
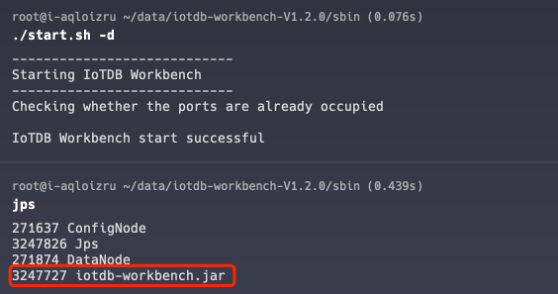
+ Linux:
```shell
# Start Workbench in the background
./start.sh -d
```
-
4. You can use the `jps` command to check if the startup was successful, as
shown in the figure:
- 
+ 
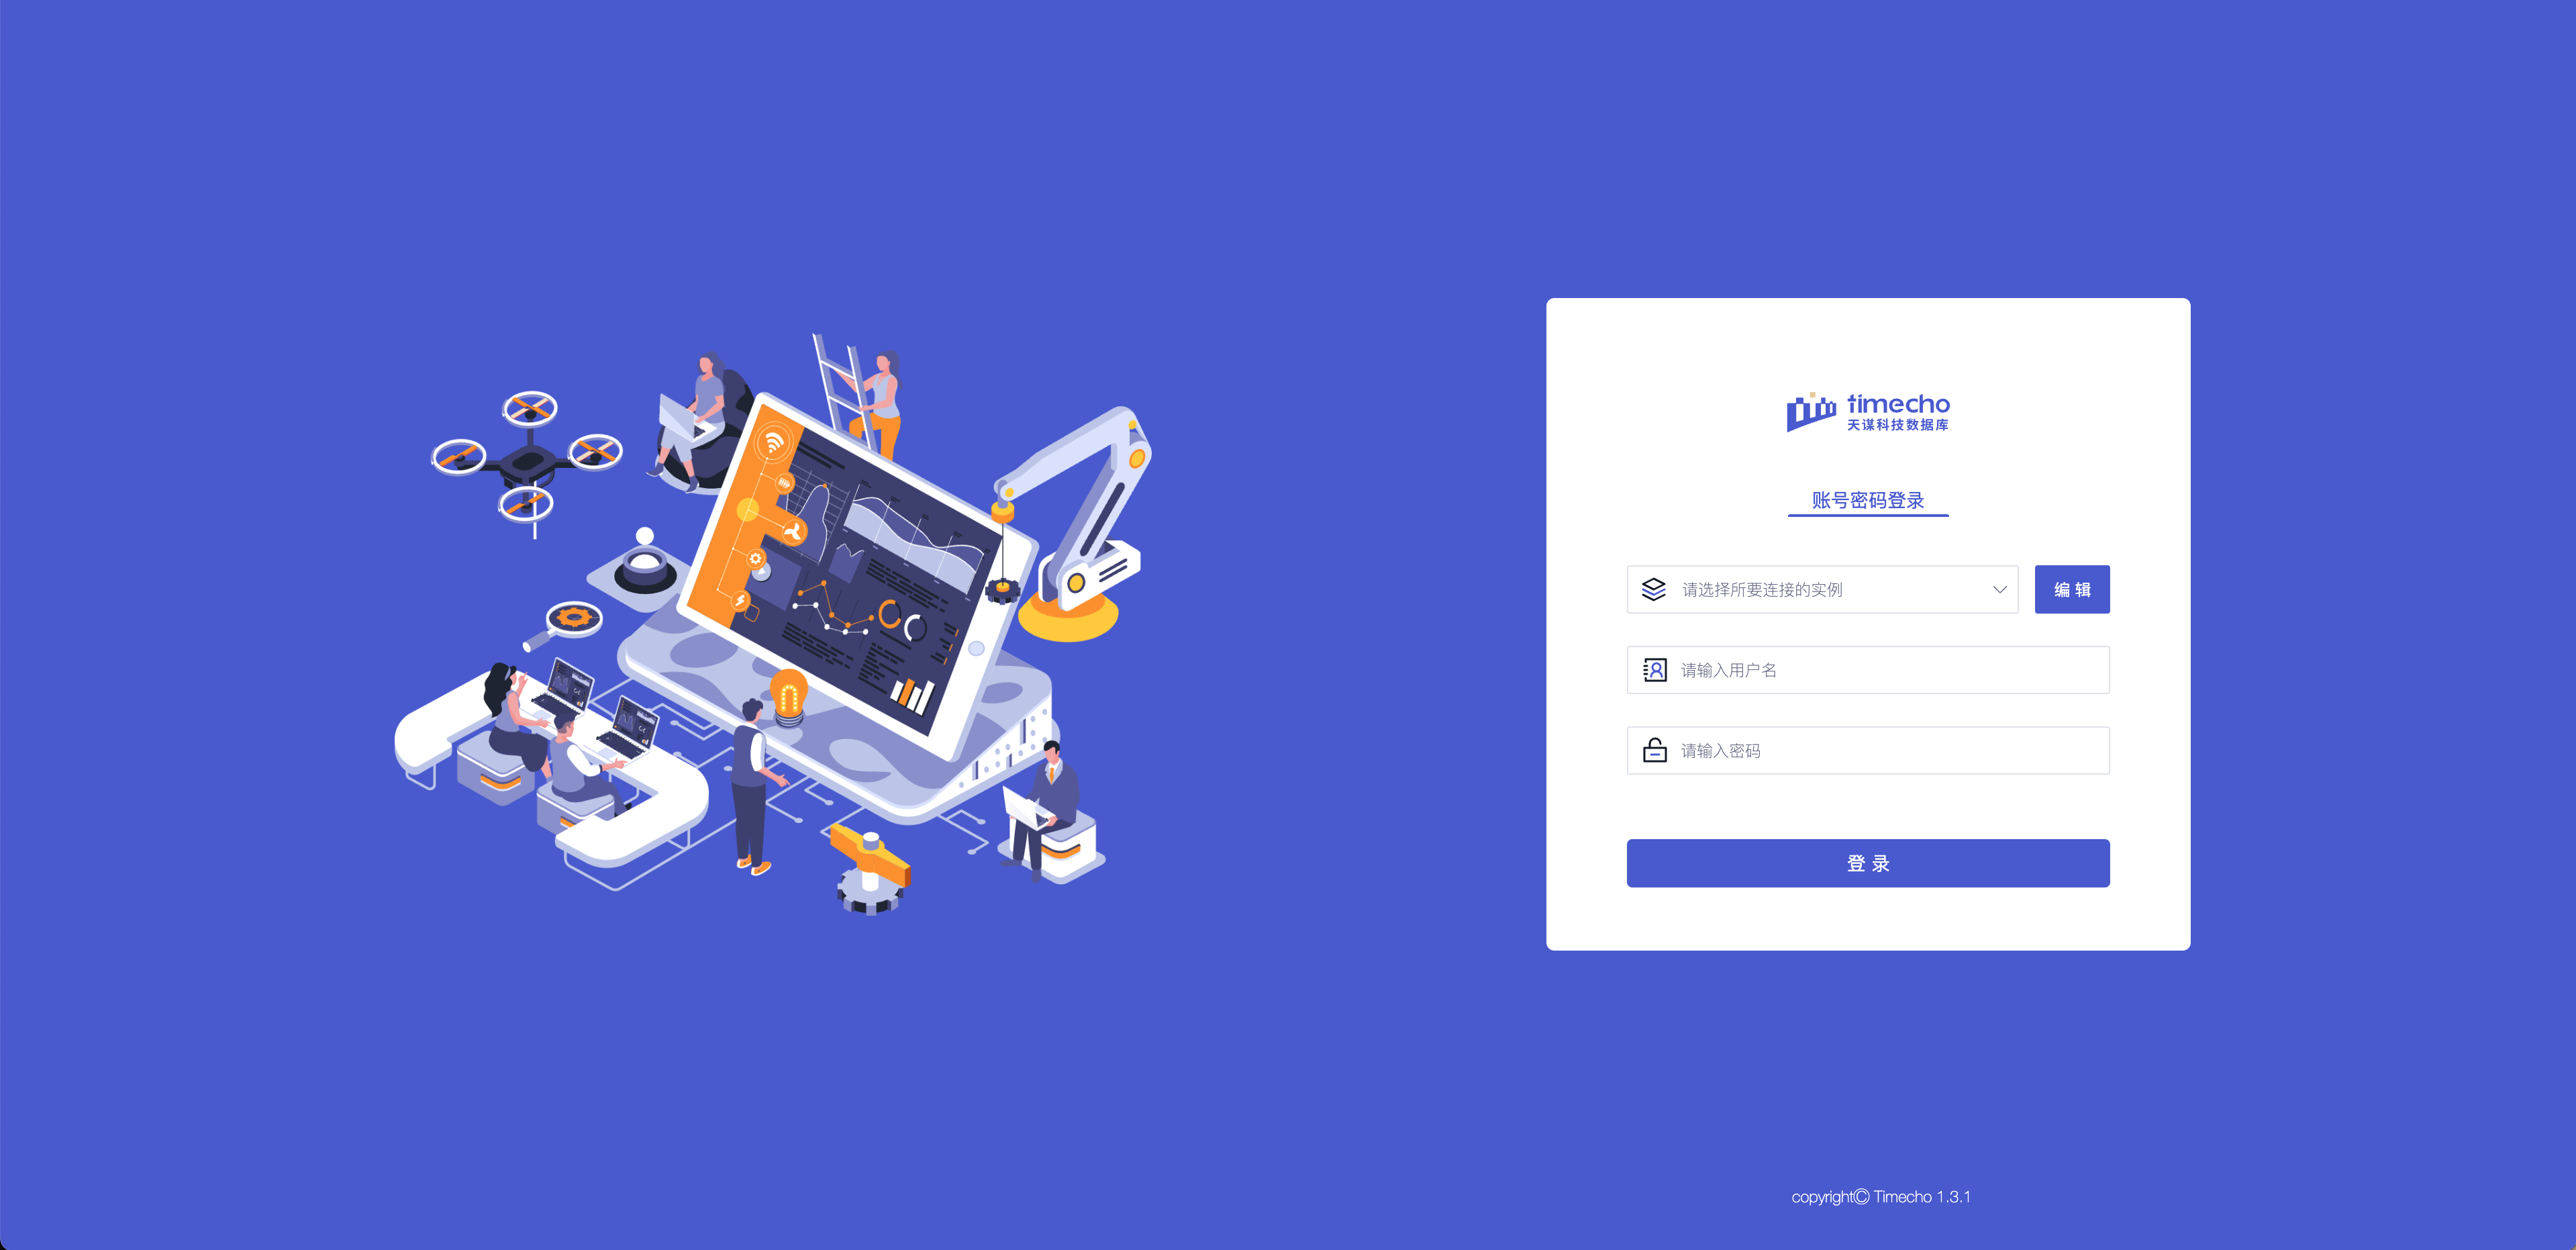
5. Verification successful: Open "`http://Server IP: Port in configuration
file`" in the browser to access, for example:"`http://127.0.0.1:9190`"; When the
login interface appears, it is considered successful

+
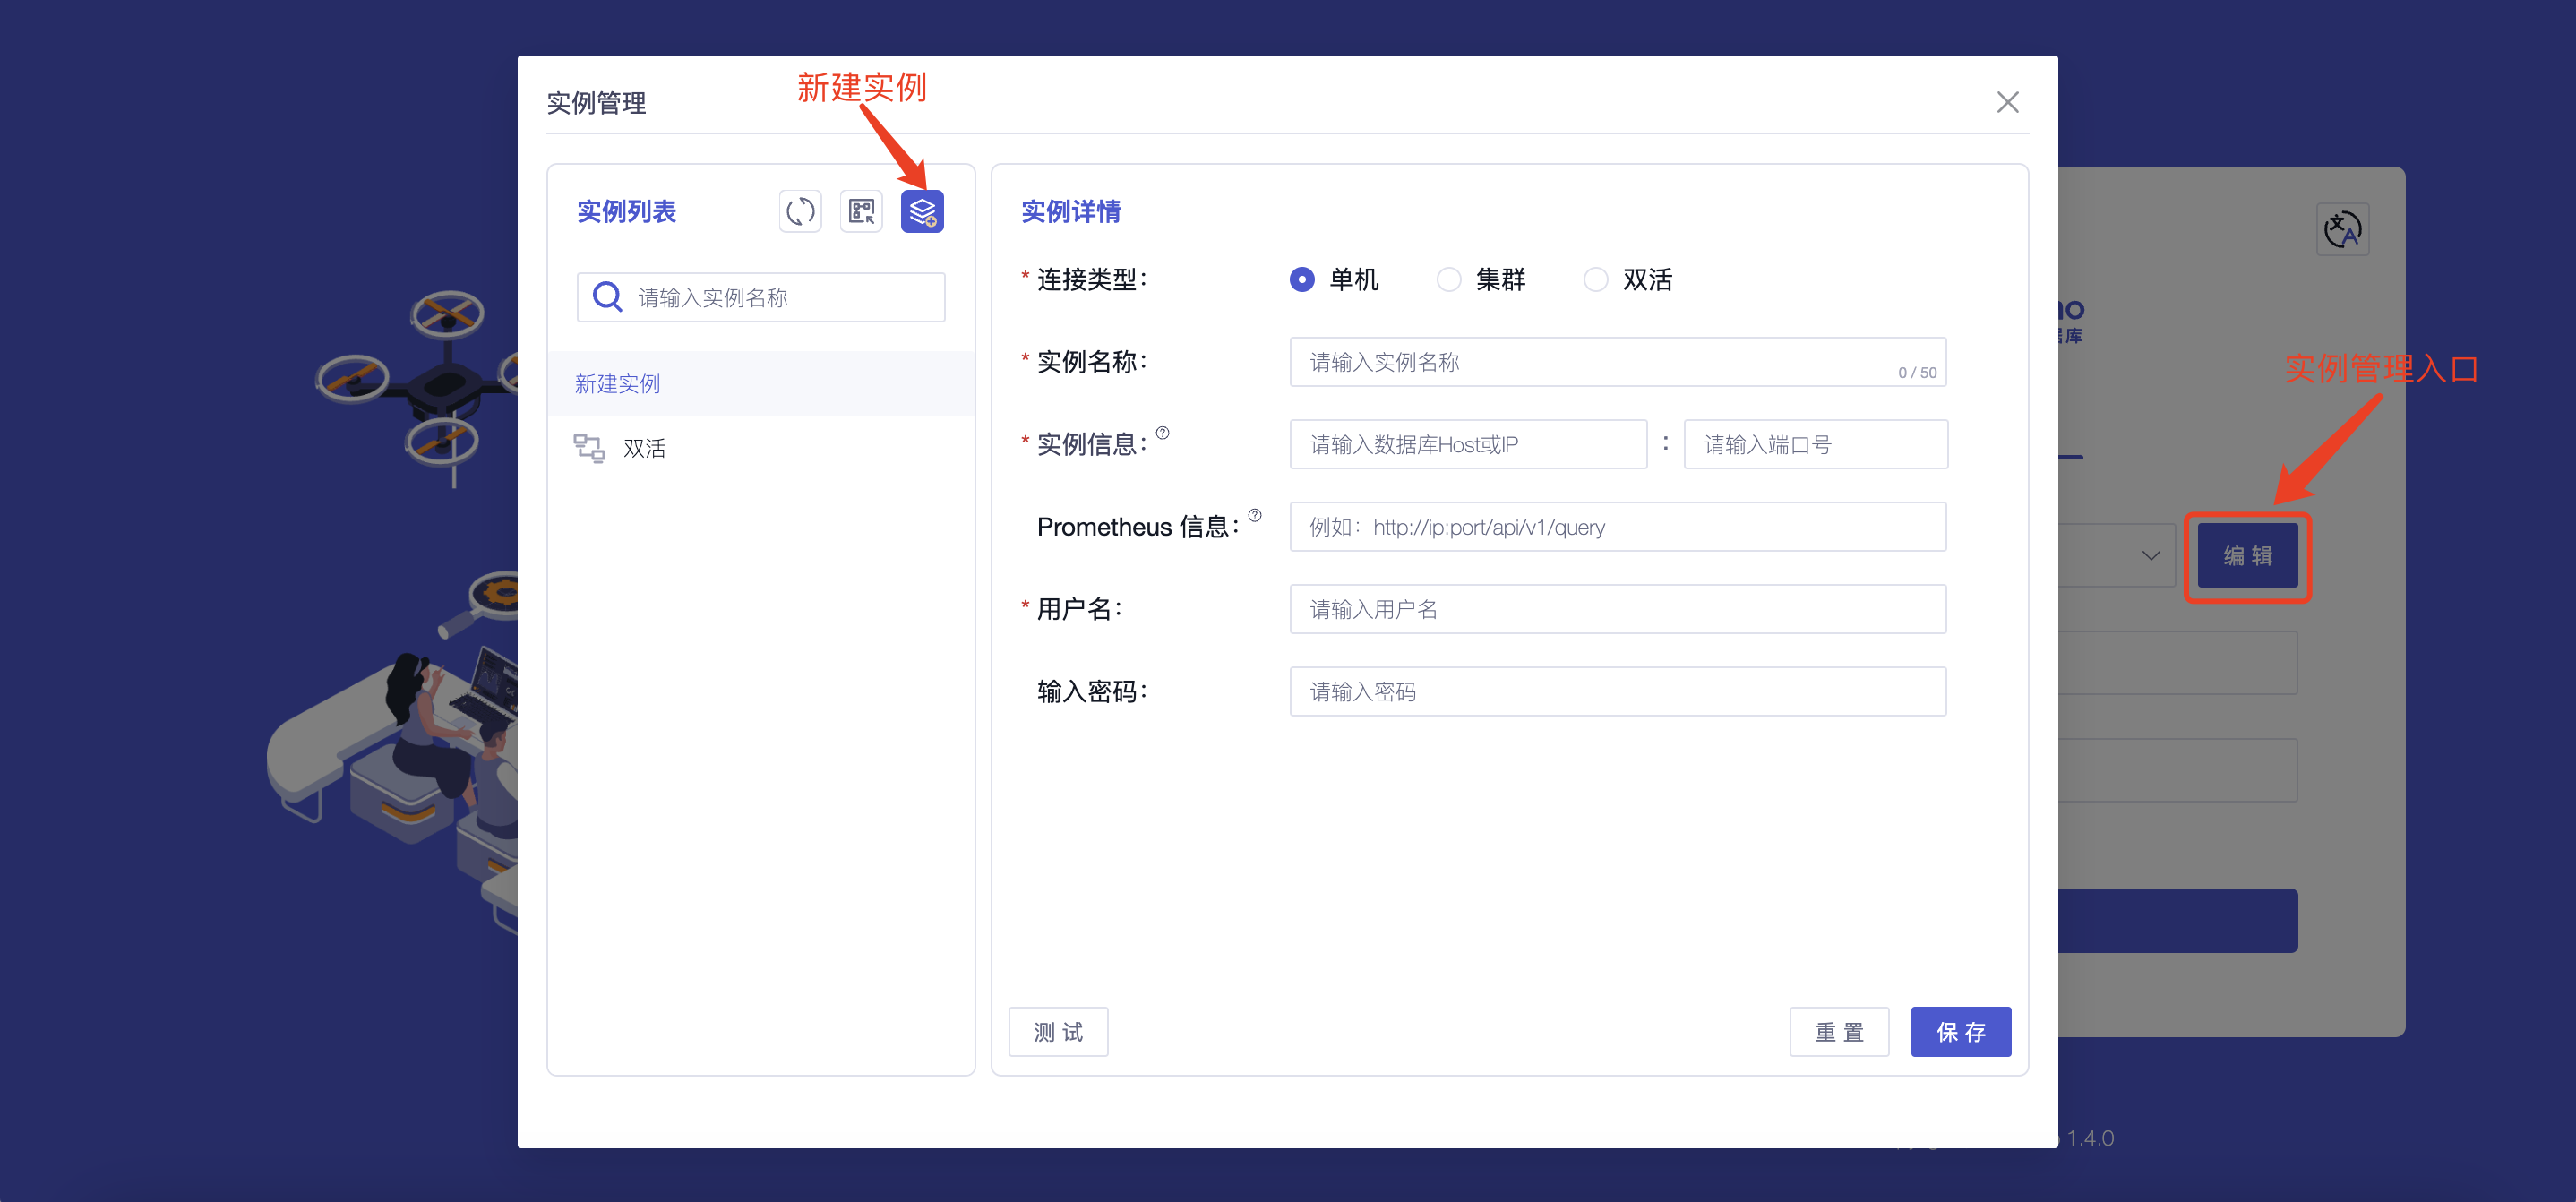
### Step 4: Configure Instance Information
1. Configure instance information: You only need to fill in the following
information to connect to the instance
diff --git
a/src/zh/UserGuide/Master/Deployment-and-Maintenance/workbench-deployment.md
b/src/zh/UserGuide/Master/Deployment-and-Maintenance/workbench-deployment.md
index defd12a6..5cee178c 100644
--- a/src/zh/UserGuide/Master/Deployment-and-Maintenance/workbench-deployment.md
+++ b/src/zh/UserGuide/Master/Deployment-and-Maintenance/workbench-deployment.md
@@ -52,45 +52,45 @@
<tr>
<td>cn_metric_reporter_list</td>
<td rowspan="3">conf/iotdb-system.properties</td>
- <td>将配置项取消注释,值设置为PROMETHEUS</td>
+ <td>请在配置文件中添加该配置项,值设置为PROMETHEUS</td>
</tr>
<tr>
<td>cn_metric_level</td>
- <td>将配置项取消注释,值设置为IMPORTANT</td>
+ <td>请在配置文件中添加该配置项,值设置为IMPORTANT</td>
</tr>
<tr>
<td>cn_metric_prometheus_reporter_port</td>
- <td>将配置项取消注释,可保持默认设置9091,如设置其他端口,不与其他端口冲突即可</td>
+ <td>请在配置文件中添加该配置项,可保持默认设置9091,如设置其他端口,不与其他端口冲突即可</td>
</tr>
<tr>
<td>dn_metric_reporter_list</td>
<td rowspan="4">conf/iotdb-system.properties</td>
- <td>将配置项取消注释,值设置为PROMETHEUS</td>
+ <td>请在配置文件中添加该配置项,值设置为PROMETHEUS</td>
</tr>
<tr>
<td>dn_metric_level</td>
- <td>将配置项取消注释,值设置为IMPORTANT</td>
+ <td>请在配置文件中添加该配置项,值设置为IMPORTANT</td>
</tr>
<tr>
<td>dn_metric_prometheus_reporter_port</td>
- <td>将配置项取消注释,可保持默认设置9092,如设置其他端口,不与其他端口冲突即可</td>
+ <td>请在配置文件中添加该配置项,可保持默认设置9092,如设置其他端口,不与其他端口冲突即可</td>
</tr>
<tr>
<td>dn_metric_internal_reporter_type</td>
- <td>将配置项取消注释,值设置为IOTDB</td>
+ <td>请在配置文件中添加该配置项,值设置为IOTDB</td>
</tr>
<tr>
<td>enable_audit_log</td>
<td rowspan="3">conf/iotdb-system.properties</td>
- <td>将配置项取消注释,值设置为true</td>
+ <td>请在配置文件中添加该配置项,值设置为true</td>
</tr>
<tr>
<td>audit_log_storage</td>
- <td>将配置项取消注释</td>
+ <td>请在配置文件中添加该配置项,值设置为IOTDB,LOGGER</td>
</tr>
<tr>
<td>audit_log_operation</td>
- <td>将配置项取消注释</td>
+ <td>请在配置文件中添加该配置项,值设置为DML,DDL,QUERY</td>
</tr>
</table>
@@ -122,8 +122,8 @@
```shell
global:
- scrape_interval: 15s
- evaluation_interval: 15s
+ scrape_interval: 15s
+ evaluation_interval: 15s
scrape_configs:
- job_name: "prometheus"
static_configs:
@@ -153,8 +153,6 @@
### 步骤三:安装Workbench
-#### Windows版:
-
1. 进入iotdb-Workbench-`<version>`的config目录
2.
修改Workbench配置文件:进入`config`文件夹下修改配置文件`application-prod.properties`。若您是在本机安装则无需修改,若是部署在服务器上则需修改IP地址
@@ -168,6 +166,13 @@
3. 启动程序:请在IoTDB-Workbench-`<version>`的sbin文件夹下执行启动命令
+ Windows版:
+ ```shell
+ # 后台启动Workbench
+ start.sh -d
+ ```
+
+ Linux版:
```shell
# 后台启动Workbench
start.bat -d
@@ -181,53 +186,6 @@
-#### Linux版:
-
-1. 进入IoTDB-Workbench-`<version>`目录
-
-2.
修改Workbench配置:进入`config`文件夹下修改配置文件`application-prod.properties`。若您是在本机安装则无需修改,若是部署在服务器上则需修改IP地址
- > Workbench可以部署在本地或者云服务器,只要能与 IoTDB 连接即可
-
- | 配置项 | 修改前 | 修改后
|
- | ---------------- | --------------------------------- |
-------------------------------------- |
- | pipe.callbackUrl | pipe.callbackUrl=`http://127.0.0.1` |
pipe.callbackUrl=`http://<部署Workbench的IP地址>` |
-
- 
-
-3. 启动程序:请在IoTDB-Workbench-`<version>`的sbin文件夹下执行启动命令
-
- ```shell
- # 后台启动Workbench
- ./start.sh -d
- ```
-
-4. 可以通过`jps`命令进行启动是否成功,如图所示即为启动成功:
-
- 
-
-5. 验证是否成功:浏览器中打开
"`http://服务器ip:配置文件中端口`"进行访问,例如:"`http://127.0.0.1:9190`",当出现登录界面时即为成功
-
- 
-
-### 步骤四:配置实例信息
-
-1. 配置实例信息:您只需要填写以下信息即可连接到实例
-
-
-
- | 字段名称 | 是否为必填项 | 字段含义
| 默认值 |
- | :---------------: | :------------: |
:------------------------------------------------------------: | :------: |
- | 连接类型 | 是 | 不同连接类型连接所填内容不同,支持选择“单机、集群、双活” | - |
- | 实例名称 | 是 | 您可根据名称对不同实例进行区分,最多输入 50 个字符 | -
|
- | 实例信息 | 是 | 填写数据库的地址(iotdb/conf/iotdb-system.properties
文件中 dn_rpc_address 字段)以及端口号(dn_rpc_port字段)注:对于集群和双活点击“+”支持输入多个实例信息 | - |
- | Prometheus 信息 | 否 |
填写“http://<Prometheus的IP地址>:<Prometheus的端口号>/api/v1/query”即可通过首页查看部分监控信息,推荐您进行配置使用
| - |
- | 用户名 | 是 | 填写IoTDB的用户名,支持输入 4~32
个字符,可使用英文大小写字母、数字、特殊字符(!@#$%^&*()_+-=) | root |
- | 密码 | 否 |
填写IoTDB的密码,为了保证数据库的安全我们不会对密码进行保存,请您在每次连接实例或测试时自行填写 | root |
-
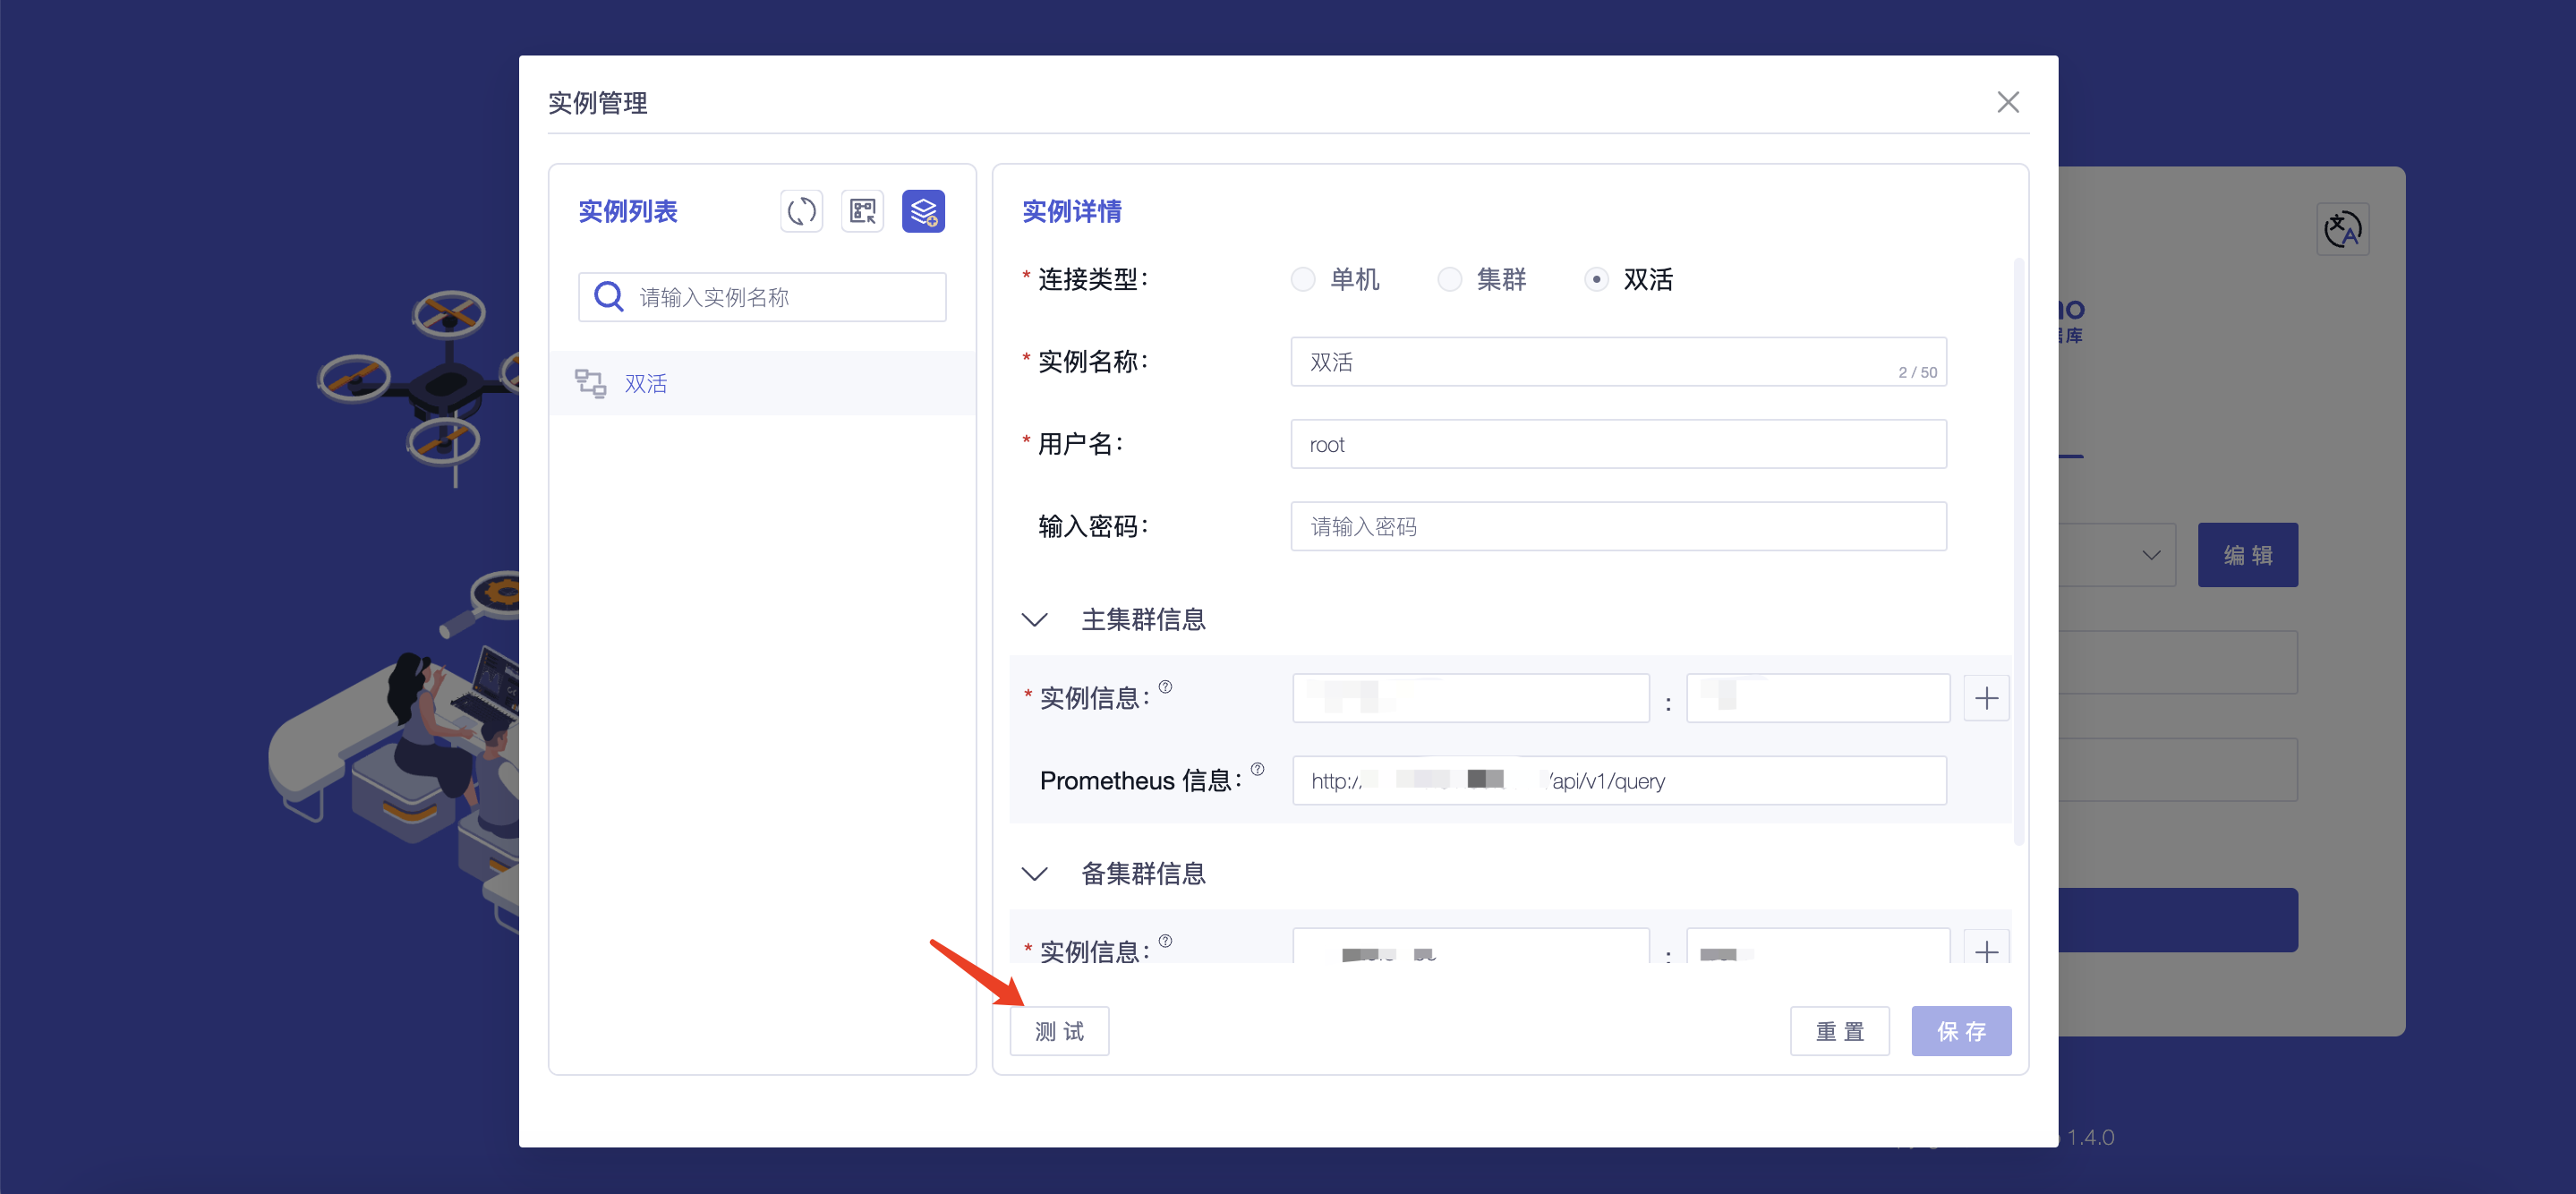
-2. 测试所填信息的准确性:您可以通过点击“测试”按钮对实例信息进行连接测试
-
-
-
## 附录:IoTDB与控制台版本对照表