tdunning commented on pull request #7076:
URL: https://github.com/apache/incubator-pinot/pull/7076#issuecomment-864807282
> @tdunning Please take a look at the modified test and see if limiting the error to be within 2% make sense for compression 200? I can't comment exactly without understanding the test. I can see that 200,000 random numbers are generated and put pair-by-pair into t-digests that are somehow serialized and combined. Ultimately, the data seems to be grouped using two fields each with 100 values resulting in a total 10,000 digests each with an average of 20 data points in them. Beyond this outline, my understanding fades to nothing. Can you say what the different between the star-index path and non-star-index path is? Without understanding the details, I think that it is a reasonable assumption to say that the difference between two digests with the same data but constructed differently will be limited by the difference between difference between either digest and the actual empirical distribution. The test, as designed, does not appear to be likely to put more than 45 data points in a single digest which means that any compression parameter greater than 100 will result in zero error because all 45 data points will be preserved. My guess is that the underlying intent of the test is a bit different from the execution, though, and you are interested in two things over a range of digest sizes: - that the star tree approach will not increase errors relative to the non star tree approach - that the t-digest will not introduce large errors in the first place for some definition of large I can say that pretty much all quantiles such that q <= 0.1 or q >= 0.9 will have really small errors with compression of 200 for as many samples as you might expect and still quite small errors with compression of 100. Here are some examples derived from 50 runs for different values of compression (delta). In general, the worst case is when there is a transition to two samples per centroid. Other than this, the accuracy for the median is generally worse than the accuracy for the tails (that is, of course, the point of the t-digest). In general, for 100 samples or more, you can occasionally have errors of more than 2% with delta=50, and will rarely have errors over 1% with delta=100 or delta=200. I don't have handy data for n < 100, for delta=200, there should never be any errors for such small counts except possibly right at the median. 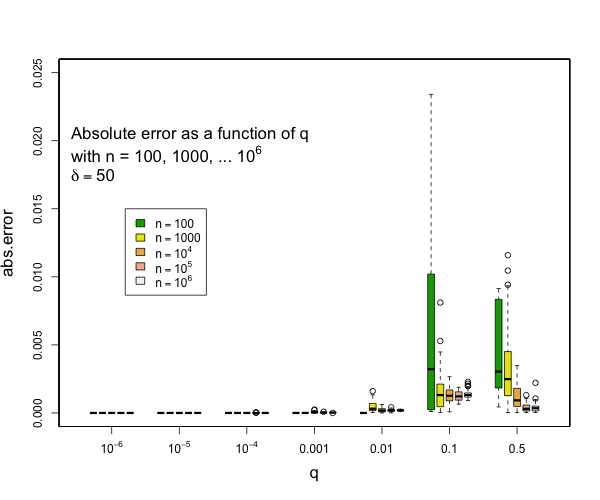 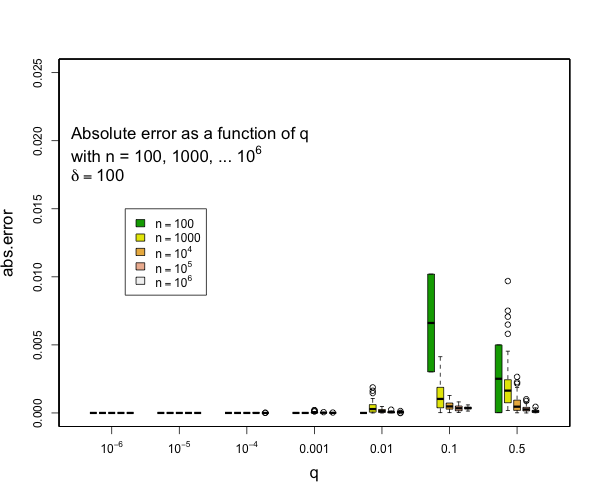 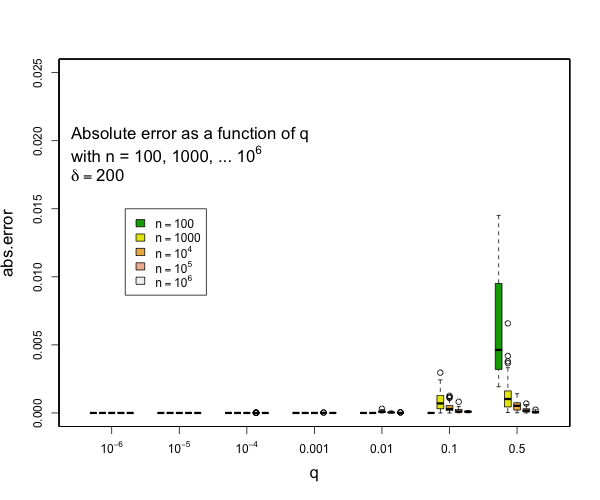 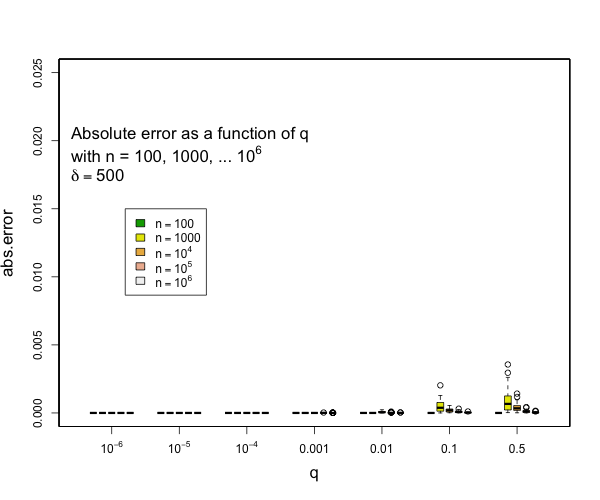 -- This is an automated message from the Apache Git Service. To respond to the message, please log on to GitHub and use the URL above to go to the specific comment. For queries about this service, please contact Infrastructure at: [email protected] --------------------------------------------------------------------- To unsubscribe, e-mail: [email protected] For additional commands, e-mail: [email protected]