frankjkelly opened a new issue, #1010:
URL: https://github.com/apache/pulsar-client-go/issues/1010
#### Expected behavior
Query we are running is
```
histogram_quantile(0.99,
sum(rate(pulsar_client_consumer_processing_time_seconds_bucket{xxxxx,pulsar_namespace=~'yyyyyy',
pod=~'zzzzzz'}[2m])) by (le, pulsar_tenant, pulsar_namespace))
```
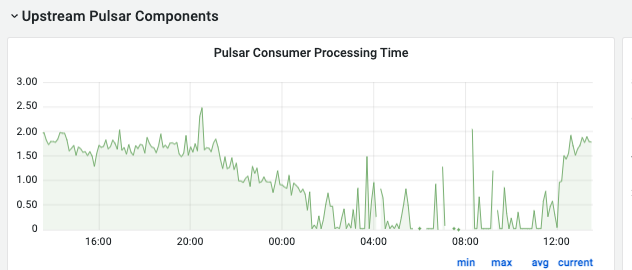
#### Actual behavior
See
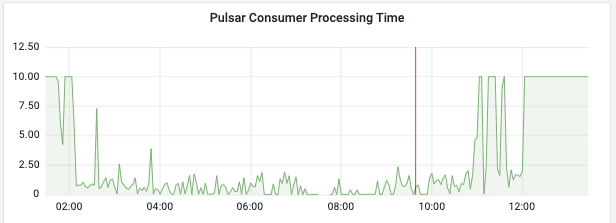
So far all our inspections suggest there are no delays but looking for
assistance in ways to confirm that.
In other environments we do not see that
Pod CPU usage is below requests CPU (and pod CPU limits are > requests)
#### Steps to reproduce
Sorry have no repro steps - just looking for ideas / help or at least
confirmation that the metric is working appropriately or that we are graphing
it appropriately.
#### System configuration
**Pulsar version**: 2.10.3
Client Version - `0.10.0`
--
This is an automated message from the Apache Git Service.
To respond to the message, please log on to GitHub and use the
URL above to go to the specific comment.
To unsubscribe, e-mail: [email protected]
For queries about this service, please contact Infrastructure at:
[email protected]