frankjkelly opened a new issue #10016:
URL: https://github.com/apache/pulsar/issues/10016
**Describe the bug** The prometheus metric `pulsar_ml_cache_used_size` exposed by Broker is negative. I would presume cache sizes should be 0 or above? **To Reproduce** 1. Launch Pulsar on Kubernetes 1. Inspect metrics endpoint of Broker ``` $ curl -s http://platform-pulsar-broker:8080/metrics/ | grep pulsar_ml_cache_used_size # TYPE pulsar_ml_cache_used_size gauge pulsar_ml_cache_used_size{cluster="platform-pulsar"} -312 1616508954848 $ curl -s http://platform-pulsar-broker:8080/metrics/ | grep pulsar_ml_cache_used_size # TYPE pulsar_ml_cache_used_size gauge pulsar_ml_cache_used_size{cluster="platform-pulsar"} -829 1616508956674 $ curl -s http://platform-pulsar-broker:8080/metrics/ | grep pulsar_ml_cache_used_size # TYPE pulsar_ml_cache_used_size gauge pulsar_ml_cache_used_size{cluster="platform-pulsar"} -308 1616508958131 $ curl -s http://platform-pulsar-broker:8080/metrics/ | grep pulsar_ml_cache_used_size # TYPE pulsar_ml_cache_used_size gauge pulsar_ml_cache_used_size{cluster="platform-pulsar"} -1039 1616508958946 ``` **Expected behavior** Cache sizes are zero or above **Screenshots** 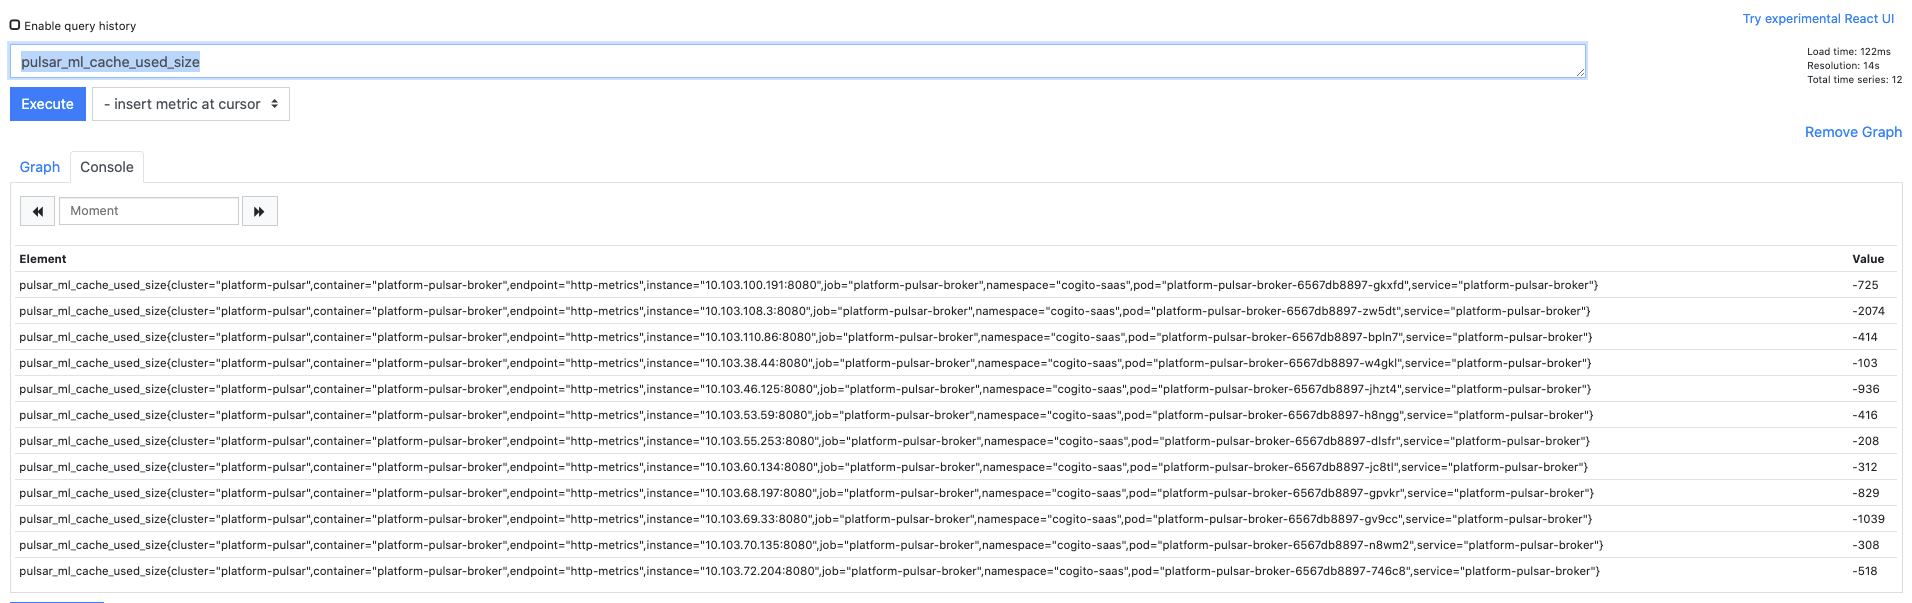 **Additional context** 1. Pulsar 2.6.1 1. Kafkaesque Helm Chart 1.0.24 1. Probably has not bearing but exposeTopicLevelMetricsInPrometheus is set to false as we have a lot of topics -- This is an automated message from the Apache Git Service. To respond to the message, please log on to GitHub and use the URL above to go to the specific comment. For queries about this service, please contact Infrastructure at: [email protected]