Maxzouz opened a new issue #11687:
URL: https://github.com/apache/pulsar/issues/11687
#### Expected behavior
RAM usage of pulsar bookie pods shouldn't exceeds xms/xmx values
#### Actual behavior
RAM usage is way over the limits fixed in config file
#### Steps to reproduce
S/O
#### System configuration
**Pulsar version**: 2.6.1
**K8s version**: v1.17.5
Hello,
I'm working on a pulsar cluster integrated inside a Rancher kubernetes
cluster and deployed via helm.
Here's the values of the bookie configmap :
> PULSAR_GC: |
-XX:+UseG1GC -XX:MaxGCPauseMillis=10 -XX:+ParallelRefProcEnabled
-XX:+UnlockExperimentalVMOptions -XX:+DoEscapeAnalysis -XX:ParallelGCThreads=32
-XX:ConcGCThreads=32 -XX:G1NewSizePercent=50 -XX:+DisableExplicitGC
-XX:-ResizePLAB -XX:+ExitOnOutOfMemoryError -XX:+PerfDisableSharedMem
-XX:+PrintGCDetails -XX:+PrintGCTimeStamps -XX:+PrintGCApplicationStoppedTime
-XX:+PrintHeapAtGC -verbosegc -Xloggc:/var/log/bookie-gc.log
-XX:G1LogLevel=finest
PULSAR_MEM: |
-Xms3g -Xmx4g -XX:MaxDirectMemorySize=2g
PULSAR_PREFIX_journalDirectories: /pulsar/data/bookkeeper/journal
autoRecoveryDaemonEnabled: "false"
dbStorage_readAheadCacheMaxSizeMb: "512"
dbStorage_rocksDB_blockCacheSize: "214748364"
dbStorage_rocksDB_writeBufferSizeMB: "64"
dbStorage_writeCacheMaxSizeMb: "512"
fileInfoFormatVersionToWrite: "1"
httpServerEnabled: "true"
httpServerPort: "8000"
journalDirectories: /pulsar/data/bookkeeper/journal
journalFormatVersionToWrite: "6"
journalMaxBackups: "1"
ledgerDirectories: /pulsar/data/bookkeeper/ledgers
openLedgerRereplicationGracePeriod: "30"
rereplicationEntryBatchSize: "5000"
statsProviderClass:
org.apache.bookkeeper.stats.prometheus.PrometheusMetricsProvider
useHostNameAsBookieID: "true"
zkLedgersRootPath: /ledgers
zkServers: pulsar-zookeeper:2181
K8S metrics give me the CPU/ RAM comsumption of my 3 bookies pods :
> pulsar-bookie-0 42m
8403Mi
pulsar-bookie-1 51m
15649Mi
pulsar-bookie-2 49m
6004Mi
Pulsar-grafana metrics shows different results :
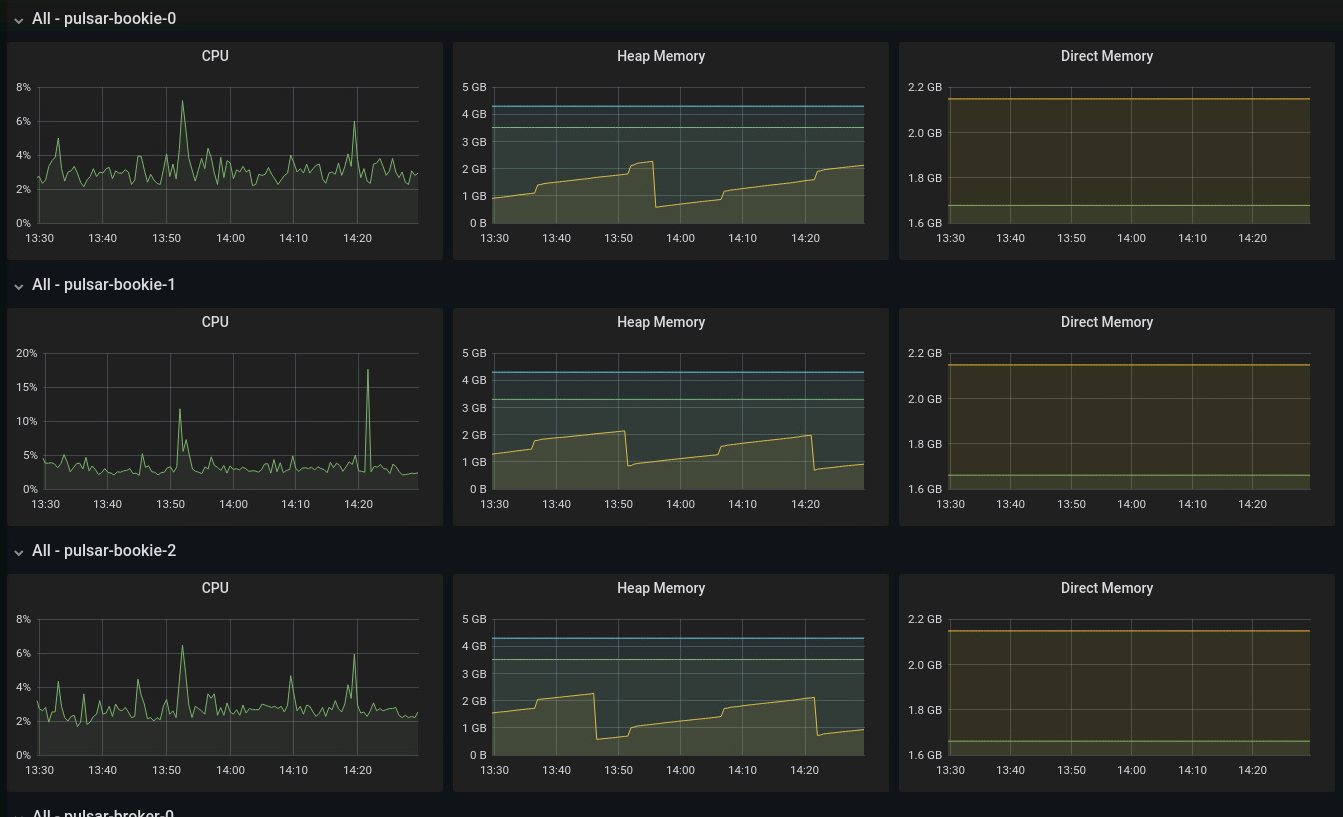
I don't understand those differences, can someone enlighten me ? Is this a
normal behavior ?
Regards,
Max
--
This is an automated message from the Apache Git Service.
To respond to the message, please log on to GitHub and use the
URL above to go to the specific comment.
To unsubscribe, e-mail: [email protected]
For queries about this service, please contact Infrastructure at:
[email protected]