bin-albin opened a new issue #13721:
URL: https://github.com/apache/pulsar/issues/13721
**Describe the bug** In the Grafana control panel, my topic number is in the tens of millions, but the actual cluster is in the tens of thousands. Other indicators are also incorrect, such as pulsar_topicS_count, pulsar_producers_count, pulsar_consumerS_count, etc and I also get inaccurate data from calling broker metrics curl -sL http://xxxxx:8721/metrics | grep pulsar_topics_count pulsar_topics_count{cluster="cluster-bj",namespace="2000001486-serverless-image/thumb"} 1707 1641971581495 Normally, the topic of this namespace is 2 , such as image-2 **Screenshots** image-1 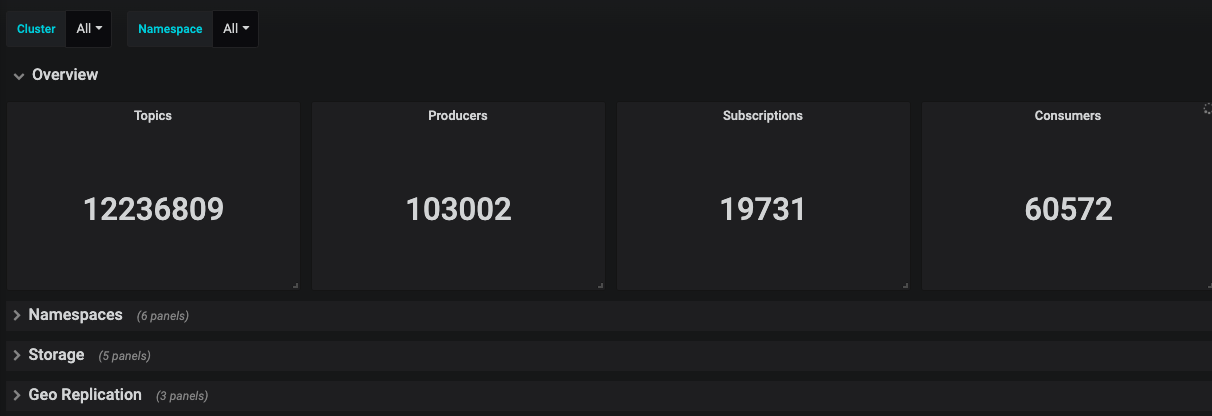 image-2 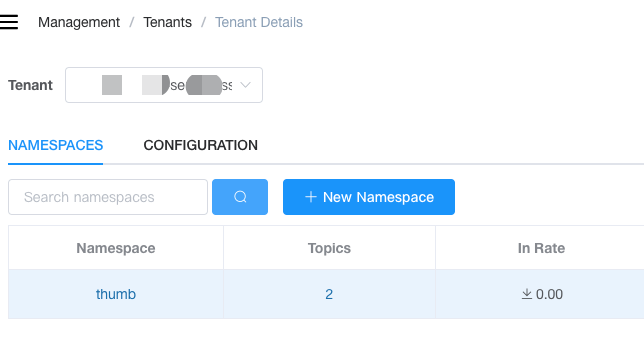 -- This is an automated message from the Apache Git Service. To respond to the message, please log on to GitHub and use the URL above to go to the specific comment. To unsubscribe, e-mail: [email protected] For queries about this service, please contact Infrastructure at: [email protected]