This is an automated email from the ASF dual-hosted git repository.

spectrometerHBH pushed a commit to branch main
in repository https://gitbox.apache.org/repos/asf/tvm.git
The following commit(s) were added to refs/heads/main by this push:
new 46a9a00c8e [DOCS][TIRX] Add in-kernel profiling (CudaProfiler)
tutorial (#19895)
46a9a00c8e is described below
commit 46a9a00c8e2ba2c69c539a46412bea0f7f5b9ac7
Author: Bohan Hou <[email protected]>
AuthorDate: Fri Jun 26 20:19:46 2026 -0700
[DOCS][TIRX] Add in-kernel profiling (CudaProfiler) tutorial (#19895)
This adds an in-kernel profiling page to the TIRx native-basics CUDA
section,
documenting the existing `tvm.tirx.bench.CudaProfiler`.
The page covers:
- a minimal load / compute / store example using `start` / `end` /
`finalize`
markers and a user-supplied `uint64` buffer;
- decoding the record buffer on the host and exporting a Perfetto trace
via
`export_to_perfetto_trace`;
- the record/tag encoding and the device code each call lowers to (a
`%globaltimer` read, a leader-only global store, and a block fence);
- usage notes: one leader per `(block, group)`, buffer sizing, the
32-bit
`%globaltimer` wrap, and the per-region cost.
The example is tested end-to-end on a CUDA GPU (B200, sm_100). It is
wired into
the `native_basics.rst` toctree after "Compiling and inspecting". The
FlashAttention-4 timeline screenshot is served from `tlc-pack/web-data`
(`images/tirx/tirx_cudaprofiler_fa4.png`), matching the other tirx doc
figures.
---
docs/tirx/native_basics.rst | 1 +
docs/tirx/native_basics/cuda/profiling.rst | 310 +++++++++++++++++++++++++++++
2 files changed, 311 insertions(+)
diff --git a/docs/tirx/native_basics.rst b/docs/tirx/native_basics.rst
index 6d37388037..62a7623ee3 100644
--- a/docs/tirx/native_basics.rst
+++ b/docs/tirx/native_basics.rst
@@ -67,3 +67,4 @@ kernels reference compile-time parameters inside type
annotations (see
native_basics/cuda/control_flow
native_basics/cuda/threads_sync
native_basics/cuda/compiling
+ native_basics/cuda/profiling
diff --git a/docs/tirx/native_basics/cuda/profiling.rst
b/docs/tirx/native_basics/cuda/profiling.rst
new file mode 100644
index 0000000000..81d4cddca7
--- /dev/null
+++ b/docs/tirx/native_basics/cuda/profiling.rst
@@ -0,0 +1,310 @@
+.. Licensed to the Apache Software Foundation (ASF) under one
+ or more contributor license agreements. See the NOTICE file
+ distributed with this work for additional information
+ regarding copyright ownership. The ASF licenses this file
+ to you under the Apache License, Version 2.0 (the
+ "License"); you may not use this file except in compliance
+ with the License. You may obtain a copy of the License at
+
+.. http://www.apache.org/licenses/LICENSE-2.0
+
+.. Unless required by applicable law or agreed to in writing,
+ software distributed under the License is distributed on an
+ "AS IS" BASIS, WITHOUT WARRANTIES OR CONDITIONS OF ANY
+ KIND, either express or implied. See the License for the
+ specific language governing permissions and limitations
+ under the License.
+
+In-kernel profiling with CudaProfiler
+=====================================
+
+Once a kernel is correct and you have seen how it compiles (see
+:doc:`compiling`), the next question is usually *where the cycles go*.
Host-side
+timers and ``nsys`` tell you how long a launch took, but not how that time
splits
+across the regions *inside* one kernel — the TMA loads, the mainloop MMAs, the
+softmax, the epilogue.
+
+``tvm.tirx.bench.CudaProfiler`` is a lightweight, in-kernel event tracer for
+exactly this. You bracket regions of device code with ``start`` / ``end``
+markers; at runtime one leader thread per block stamps the GPU global timer
into
+a buffer you pass in as an ordinary kernel argument. After the launch you read
+the buffer back and decode it into per-region durations or a Perfetto timeline.
+
+It is *not* zero cost — every event is a ``%globaltimer`` read plus a global
+store, and every thread in the region pays a block fence — so it is a
+profiling/debugging tool, not something you leave on in production.
+
+The kernel
+----------
+
+The kernel below brackets a ``load`` / ``compute`` / ``store`` sequence. The
+``compute`` region runs a 4000-iteration FMA loop so it clearly dominates.
Events
+are a plain ``enum.Enum`` whose integer values start at 0 and index a names
list.
+
+.. code-block:: python
+
+ from enum import Enum
+ import numpy as np
+ import tvm
+ from tvm.script import tirx as T
+ from tvm.tirx.bench import CudaProfiler, export_to_perfetto_trace
+
+ NUM_BLOCKS, BLOCK, NUM_GROUPS = 4, 128, 1
+ WRITE_STRIDE = NUM_BLOCKS * NUM_GROUPS # >= number of (block, group)
lanes
+ PROF_SIZE = 4096 # uint64 slots in the profiler
buffer
+ N = NUM_BLOCKS * BLOCK
+
+ class Ev(Enum):
+ Load = 0
+ Compute = 1
+ Store = 2
+
+ EV_NAMES = ["load", "compute", "store"]
+
+ @T.prim_func
+ def profiled_kernel(out_ptr: T.handle, inp_ptr: T.handle, prof_ptr:
T.handle):
+ out = T.match_buffer(out_ptr, (N,), "float32")
+ inp = T.match_buffer(inp_ptr, (N,), "float32")
+ prof = T.match_buffer(prof_ptr, (PROF_SIZE,), "uint64")
+ T.device_entry()
+ bid = T.cta_id([NUM_BLOCKS])
+ tid = T.thread_id([BLOCK])
+ idx = bid * BLOCK + tid
+
+ # Construct the profiler inside the kernel; only the leader thread
writes.
+ p = CudaProfiler(prof, write_stride=WRITE_STRIDE,
num_groups=NUM_GROUPS,
+ default_leader=(tid == 0))
+ p.init(0) # group_id = 0; also stamps the buffer
header at slot 0
+
+ p.start(Ev.Load)
+ x: T.f32 = inp[idx]
+ p.end(Ev.Load)
+
+ p.start(Ev.Compute)
+ acc: T.f32 = T.float32(0)
+ for _ in range(4000):
+ acc = acc * T.float32(1.0001) + x
+ p.end(Ev.Compute)
+
+ p.start(Ev.Store)
+ out[idx] = acc
+ p.end(Ev.Store)
+
+ p.finalize() # mark this (block, group) lane done
+
+Run it and read the trace
+-------------------------
+
+Allocate a zeroed ``uint64`` buffer, pass it as the last argument, then read it
+back. Each record is one ``uint64``: the high 32 bits are the timestamp, the
low
+32 bits a packed tag, so decoding is plain bit-twiddling on the host.
+
+.. code-block:: python
+
+ dev = tvm.cuda(0)
+ exe = tvm.compile(tvm.IRModule({"main": profiled_kernel}),
+ target=tvm.target.Target("cuda"), tir_pipeline="tirx")
+
+ inp = tvm.runtime.tensor(np.ones(N, "float32"), device=dev)
+ out = tvm.runtime.tensor(np.zeros(N, "float32"), device=dev)
+ prof = tvm.runtime.tensor(np.zeros(PROF_SIZE, "uint64"), device=dev)
+
+ exe(out, inp, prof)
+ dev.sync()
+
+ prof_np = prof.numpy()
+ opens, spans = {}, {}
+ for i in range(1, len(prof_np)):
+ word = int(prof_np[i])
+ if word == 0:
+ continue
+ ts, tag = word >> 32, word & 0xFFFFFFFF
+ block = (tag >> 12) // NUM_GROUPS
+ event_idx, event_type = (tag >> 2) & 0x3FF, tag & 0x3 # 0=start
1=end 2=instant 3=finalize
+ if event_type == 0:
+ opens[(block, event_idx)] = ts
+ elif event_type == 1:
+ spans.setdefault(block, []).append((EV_NAMES[event_idx], ts -
opens[(block, event_idx)]))
+ for block in sorted(spans):
+ print(f"block {block}:", ", ".join(f"{n}={d}ns" for n, d in
spans[block]))
+
+ export_to_perfetto_trace(prof_np, "cudaprofiler.perfetto-trace", EV_NAMES)
+
+Durations are stable to within a few percent (they shift with GPU clocks)::
+
+ block 0: load=32ns, compute=8704ns, store=64ns
+ block 1: load=96ns, compute=8704ns, store=64ns
+ block 2: load=96ns, compute=8704ns, store=64ns
+ block 3: load=96ns, compute=8704ns, store=64ns
+
+``export_to_perfetto_trace`` writes ``cudaprofiler.perfetto-trace`` from the
same
+records; drop it onto https://ui.perfetto.dev for an interactive timeline.
Because
+the timestamps come from the global ``%globaltimer`` (not a per-SM cycle
counter),
+events from different blocks share one time axis and are directly comparable.
+
+On a real kernel
+----------------
+
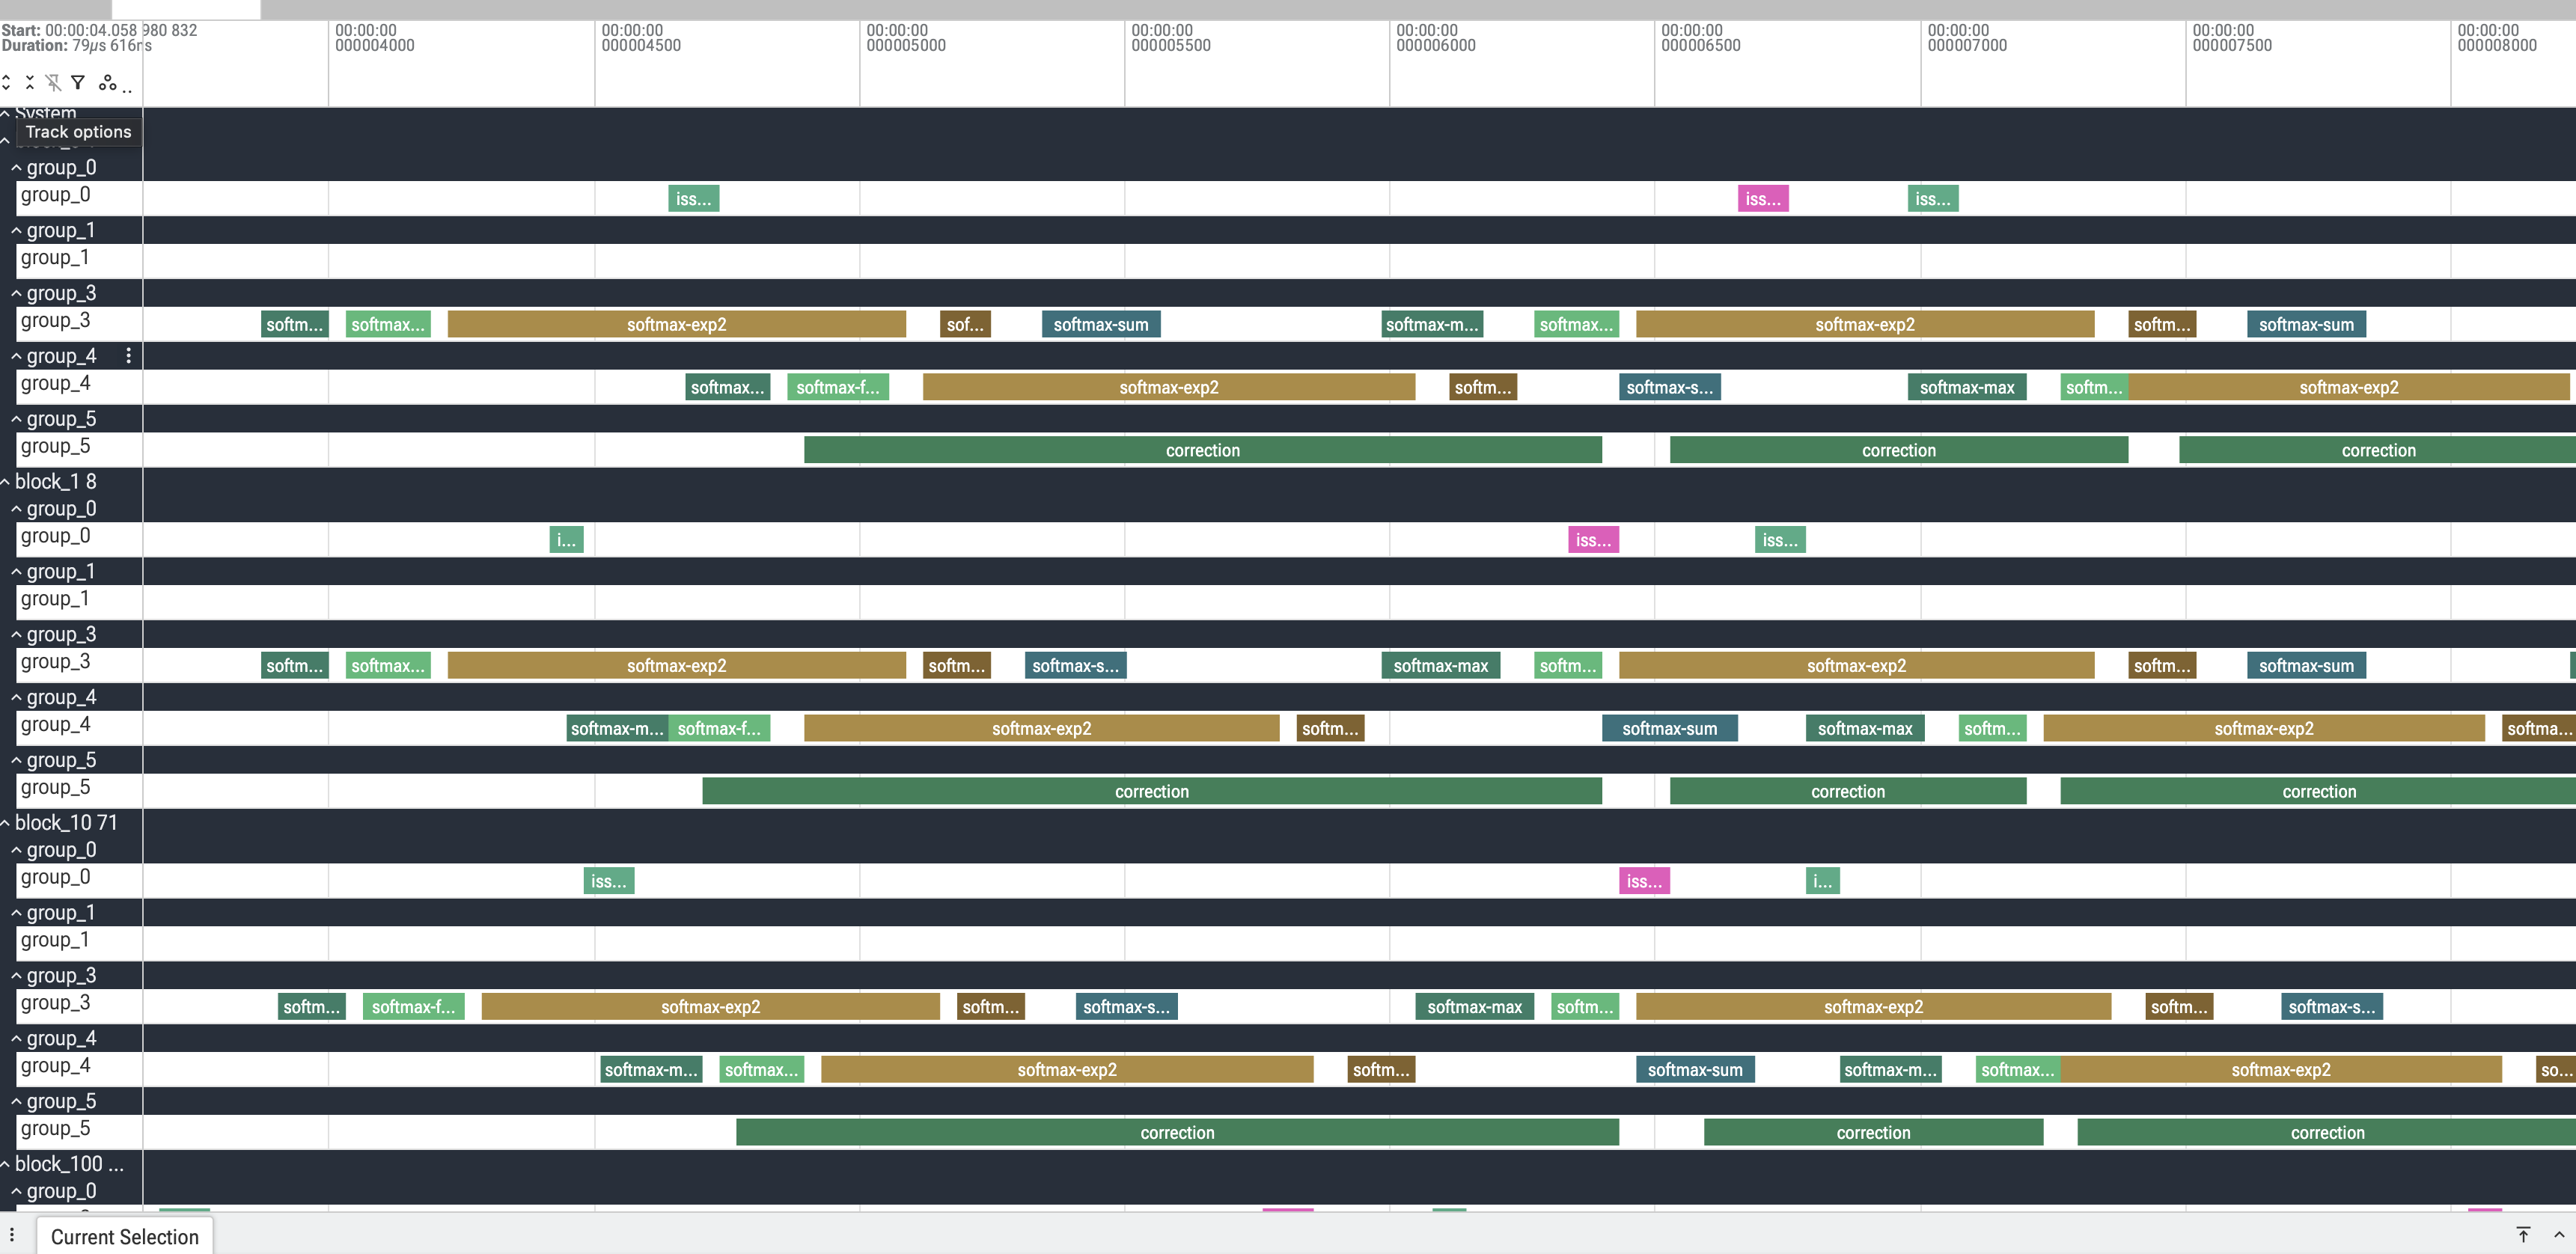
+The same markers, sprinkled through a warp-specialized FlashAttention-4 kernel
+(one ``group`` per warp-group via ``num_groups``), produce a per-warp-group
+timeline of the whole pipeline:
+
+.. figure::
https://raw.githubusercontent.com/tlc-pack/web-data/main/images/tirx/tirx_cudaprofiler_fa4.png
+ :align: center
+ :alt: FlashAttention-4 in-kernel timeline in Perfetto
+
+ One CTA of an FA4 forward kernel. ``group_0`` issues the TMA loads
+ (``issue-tma-*``), ``group_3`` / ``group_4`` run the softmax pipeline
+ (``softmax-max`` / ``-exp2`` / ``-sum``), and ``group_5`` runs the
+ ``correction`` — the overlap between the producer and consumer warp-groups
is
+ exactly what intra-kernel profiling is for.
+
+The API
+-------
+
+Construct the profiler **inside** the kernel body and call four methods:
+
+* ``init(group_id)`` — once per thread; ``group_id`` selects the sub-track and
+ stamps the buffer header at slot 0.
+* ``start(event_type, leader=None)`` / ``end(event_type, leader=None)`` — open
and
+ close a region. Every thread executes them, but only the leader stores a
record.
+* ``finalize(leader=None)`` — write a terminal record for this lane.
+
+Constructor arguments:
+
+* ``profiler_buffer`` — the ``uint64`` buffer you pass into the kernel.
+* ``write_stride`` — how far each leader advances between writes. Must be
``>=``
+ the number of ``(block, group)`` lanes so per-lane streams never collide;
+ ``NUM_BLOCKS * NUM_GROUPS`` is the tight value, a persistent-grid kernel uses
+ ``num_sms * num_groups``.
+* ``num_groups`` — independent sub-tracks per block. Use ``1`` for a plain
kernel;
+ in a warp-specialized kernel give each warp-group its own ``group_id`` and
+ leader so their timelines don't mix.
+* ``default_leader`` — the predicate for the one writing thread (override per
call
+ with ``leader=``).
+* ``profiler_enabled`` — pass ``False`` (or a false-y ``PrimExpr``) to turn
every
+ method into a no-op, so you can leave the markers in and compile them out.
+
+``CudaProfiler`` emits ``start`` / ``end`` / ``finalize``; ``instant`` (event
type
+2) is reserved in the wire format and understood by the decoder, but there is
no
+method that produces one.
+
+Groups and granularity
+----------------------
+
+A block's threads are partitioned into ``num_groups`` logical *groups*, and the
+trace's unit is one ``(block, group)`` lane — each becomes its own track. The
+partition is yours: a group can be a warp-group, a single warp, or any set of
+threads, and it does **not** have to align to a warp (the recording path has no
+warp-collective op — just a predicated per-thread store and a block fence). Two
+rules:
+
+* a thread joins a group by calling ``init(group_id)``, which points *its*
write
+ cursor at that group's lane;
+* exactly one thread per group is the leader and actually writes — pick it
with a
+ predicate that is true for one thread in the group, and it must be a thread
that
+ called ``init`` for that group.
+
+Because each leader has its own cursor, one ``start`` / ``end`` statement
records
+into *every* group at once: each leader stamps its own lane.
+
+**Groups as warp-groups.** A 256-thread block is two warp-groups; give each its
+own ``group_id`` and make its first thread the leader. Here the two
warp-groups do
+different amounts of compute, so their tracks have different durations:
+
+.. code-block:: python
+
+ NUM_GROUPS = 2
+ p = CudaProfiler(prof, write_stride=NUM_BLOCKS * NUM_GROUPS,
num_groups=NUM_GROUPS,
+ default_leader=(tid % 128 == 0)) # first thread of each
warp-group
+ if tid < 128:
+ p.init(0)
+ else:
+ p.init(1)
+ # ... load ...
+ p.start(Ev.Compute)
+ if tid < 128:
+ for _ in range(1000): # warp-group 0: light
+ acc = acc * T.float32(1.0001) + x
+ else:
+ for _ in range(5000): # warp-group 1: heavy
+ acc = acc * T.float32(1.0001) + x
+ p.end(Ev.Compute)
+
+::
+
+ block 0 group 0: load=96ns, compute=3040ns, store=64ns
+ block 0 group 1: load=96ns, compute=10816ns, store=64ns
+ block 1 group 0: load=96ns, compute=3072ns, store=64ns
+ block 1 group 1: load=128ns, compute=10784ns, store=64ns
+
+**Groups that are not warp multiples.** A 128-thread block split 48 / 48 / 32
+works the same way — the leaders are the base thread of each group, and the
+48-thread groups (1.5 warps, crossing warp boundaries) each record a correct
+track:
+
+.. code-block:: python
+
+ NUM_GROUPS = 3 # groups [0, 48) [48, 96)
[96, 128)
+ p = CudaProfiler(prof, write_stride=NUM_BLOCKS * NUM_GROUPS,
num_groups=NUM_GROUPS,
+ default_leader=((tid == 0) | (tid == 48) | (tid == 96)))
+ if tid < 48:
+ p.init(0)
+ elif tid < 96:
+ p.init(1)
+ else:
+ p.init(2)
+
+::
+
+ block 0 group 0: load=96ns, compute=4544ns, store=64ns # 48 threads (1.5
warps)
+ block 0 group 1: load=64ns, compute=4512ns, store=96ns # 48 threads,
crosses warp lines
+ block 0 group 2: load=64ns, compute=4576ns, store=64ns # 32 threads
+
+What each call wraps
+--------------------
+
+The methods are thin wrappers around the ``T.cuda.timer_*`` intrinsics, which
+lower to small ``__device__`` helpers emitted into the generated CUDA. The
+profiler keeps two per-thread ``"local"`` scratch slots — the running tag and
+write cursor — and every record is written by:
+
+.. code-block:: c++
+
+ // tvm_builtin_get_timestamp() == asm("mov.u32 %0, %globaltimer_lo;")
+ profiler_buffer[profiler_write_offset[0]] =
+ ((uint64_t)tvm_builtin_get_timestamp() << 32) | (profiler_tag[0] |
event_bits);
+ profiler_write_offset[0] += profiler_write_stride; // global store; only
the leader runs this
+
+``init`` computes ``BLOCK_GROUP_IDX = block_idx * num_groups + group_id``,
writes
+the header ``profiler_buffer[0] = ((uint64_t)num_groups << 32) | num_blocks``
from
+block 0 / ``threadIdx.x == 0``, and seeds this lane's cursor to ``1 +
+BLOCK_GROUP_IDX`` and tag to ``BLOCK_GROUP_IDX << 12``. ``start`` writes the
record
+(``event_bits = (event << 2) | 0``) then ``__threadfence_block()``; ``end``
fences
+then writes (``| 1``); ``finalize`` fences then writes ``0x3``. The fence runs
on
+*every* thread in the region, only the store is leader-only — that fence is
what
+brackets the region's memory traffic, and why the markers perturb the kernel.
+
+Usage notes and caveats
+-----------------------
+
+* **Zero the buffer before the launch.** The decoder treats ``0`` as "empty"
and
+ reads the grid shape from slot 0, which only block 0 / thread 0 writes.
+* **Exactly one leader per (block, group).** Each thread keeps its own cursor,
+ initialized to ``1 + block_group``; two leaders in the same lane write the
same
+ offsets and clobber each other. Use ``tid == 0`` or lane 0 of the group's
leader
+ warp.
+* **Call ``init`` once, before any ``start``.** It seeds each thread's tag and
+ cursor; without it both are garbage.
+* **Size ``write_stride`` and the buffer together.** The largest slot a lane
+ touches is ``1 + block_group + (records_per_lane - 1) * write_stride``;
+ over-allocate, unused slots stay ``0`` and are skipped.
+* **``%globaltimer_lo`` is only the low 32 bits of the nanosecond timer.** It
wraps
+ about every 4.29 s (``2**32`` ns), so a region straddling a wrap decodes to a
+ bogus duration. Resolution is coarse (tens of ns), so very short regions
read 0
+ or a single tick.
+* **No payload.** ``start`` / ``end`` record only a timestamp and the event id;
+ encode anything extra in the event id (a distinct ``Ev`` member) or in
+ ``num_groups``.
+* **It is not free.** Two stores plus two block fences per region. Profile,
read
+ the numbers, then build with ``profiler_enabled=False``.