JiaLiangC opened a new pull request, #4182:
URL: https://github.com/apache/ambari/pull/4182
Issue: [AMBARI-26638](https://issues.apache.org/jira/browse/AMBARI-26638) ## What changes were proposed in this pull request? This pull request replaces the legacy Ambari Metrics System with a Prometheus-compatible monitoring architecture backed by VictoriaMetrics. It is based on the current `frontend-refactor` branch and contains only the Metrics migration commits; already merged AMBARI-26634 frontend work is not repeated. ### Architecture and migration - Adds an Ambari Agent telemetry runtime for native Linux metrics and stack-defined component JMX profiles. The server compiles assignments and distributes them through the existing realtime channel, while agents expose normalized Prometheus endpoints without requiring a restart for assignment changes. - Adds server-side HTTP service discovery, Prometheus query proxying, datasource management, dashboard persistence, chart sharing, builtin provisioning, and the database upgrade from legacy widgets/layouts to the new model. - Adds a VictoriaMetrics package and BIGTOP stack service with VictoriaMetrics Server, VMAGENT, and VMAUTH components, verified architecture-specific artifacts, quick links, alerts, topology recommendations, and service dashboards. - Removes the obsolete AMS, Ganglia, timeline-metrics, legacy widget, and SCOM implementation paths instead of maintaining two monitoring systems in parallel. ### Deployment reliability - Provisions a managed Ambari HTTP service-discovery identity and the `victoriametrics-scrape` configuration before VMAGENT startup. Provisioning is idempotent and applies during both cluster creation and later service installation. - Prepares Metrics runtime directories, excludes the Metrics RPM from stack-select, permits RPM version overrides, and enforces a deployable VictoriaMetrics component topology. - Preserves encoded PromQL query parameters and tolerates absent realtime service-update payloads so monitoring failures do not break unrelated service pages. ### React monitoring experience - Adds dashboard catalog, dashboard editor and panels, Prometheus explorer, scrape targets, datasources, and shared-chart workflows with authorization checks and error handling. - Provisions Linux fleet/host dashboards and service dashboards for HDFS, YARN, HBase, and Hive, and exposes them from the relevant service pages. - Adds a generic service summary for services without a specialized React component. It renders master, worker, and client component health, counts, alerts, maintenance state, host/component navigation, and an explicit empty state. - Uses the authoritative service state stream for sidebar health, fixing the gray VictoriaMetrics status indicator after a successful start. ### Commit breakdown 1. Add Ambari Agent Prometheus telemetry. 2. Replace legacy monitoring with Prometheus and VictoriaMetrics. 3. Expose VictoriaMetrics in React service navigation. 4. Provision the managed Metrics discovery identity. 5. Prepare Metrics runtime directories. 6. Preserve PromQL query parameter encoding. 7. Fix monitoring route contract types. 8. Guard missing service update messages. 9. Allow the Metrics RPM version to be overridden. 10. Add native Linux telemetry dashboards. 11. Harden React monitoring data handling. 12. Enforce VictoriaMetrics deployment topology. 13. Exclude the Metrics RPM from stack-select. 14. Provision the Metrics identity before VMAGENT startup. 15. Expose Hive monitoring dashboards. 16. Add the generic service summary and live sidebar health state. 17. Add runtime screenshots from the three-node deployment. 18. Index the runtime evidence used by this pull request. ## How was this patch tested? The final branch was rebased onto the latest `origin/frontend-refactor` before validation. The focused generic-summary suite passed 1 test file and 2 tests, the TypeScript/Vite production build completed successfully, and `git diff --check` reported no errors. The build emitted only the branch's existing Sass deprecation warnings and the Vite large-chunk advisory. Runtime validation used a three-node Rocky Linux 8 ARM64 container cluster. Ambari Blueprint request 13 completed at 100 percent. The initial managed `victoriametrics-scrape` configuration contained the generated discovery identity before VMAGENT startup; VMAGENT completed its first INSTALL and START; and VictoriaMetrics Server, VMAGENT, and VMAUTH all reached `STARTED`. A final Ambari REST check returned service state `STARTED` and `1/1` started instances for all three components. The updated React assets were deployed into the running Ambari Server. Real Chrome validation confirmed the VictoriaMetrics service summary, green sidebar health state, dashboard catalog, Linux/HDFS/HBase metric queries, and healthy Prometheus scrape targets. The screenshots below are from that deployment. The Ambari Server module was compiled under JDK 17 with tests and static checks skipped for the runtime hot-deployment cycle. Full server and agent suites were not rerun after the final history-only rebase; no source conflicts occurred during that rebase. ```shell cd ambari-web/latest npm test -- --run src/screens/Services/ServiceComponents.test.tsx npm run build cd ../.. git diff --check origin/frontend-refactor...HEAD ``` 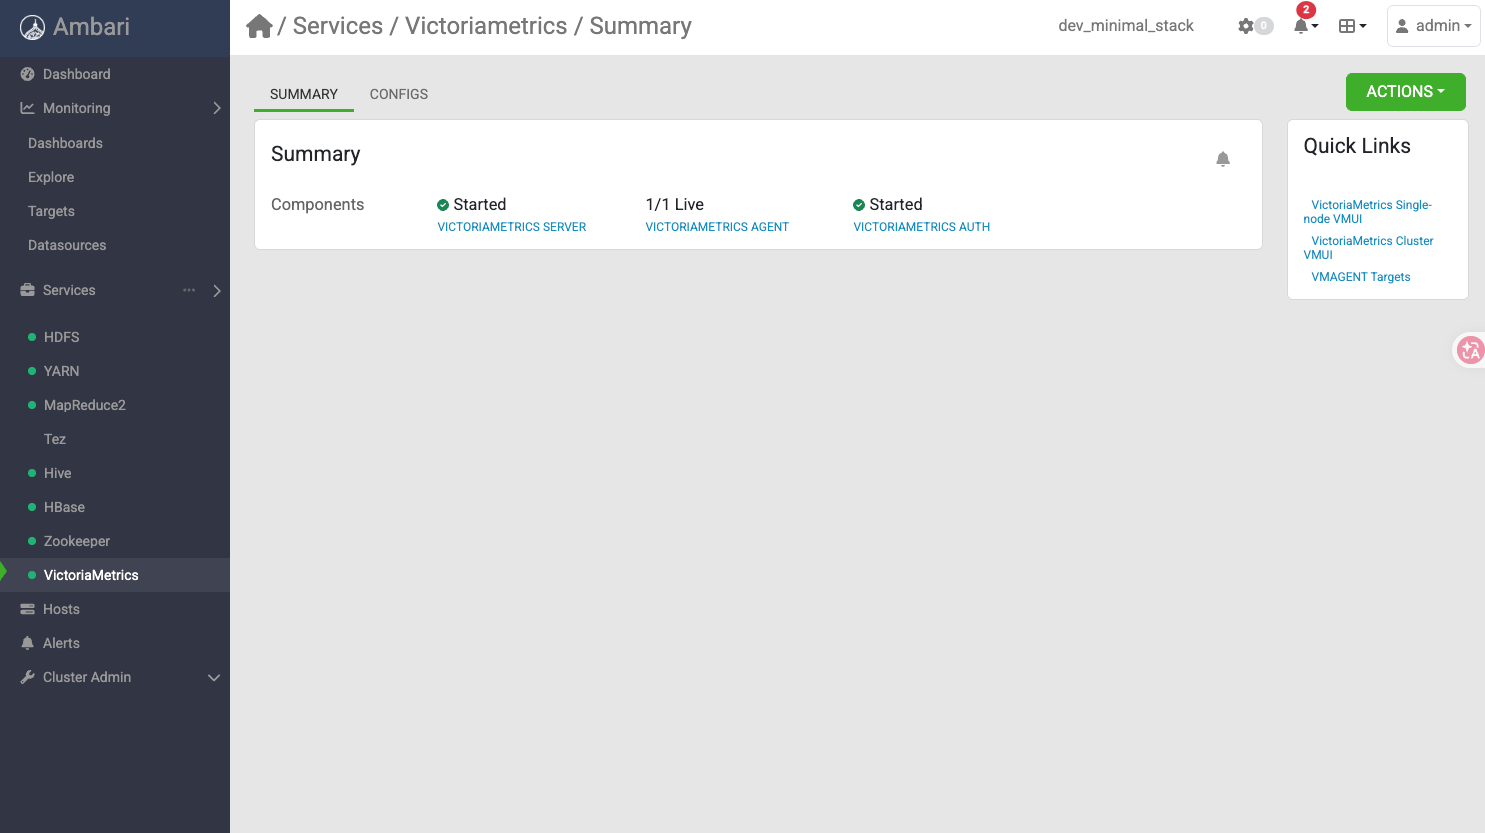 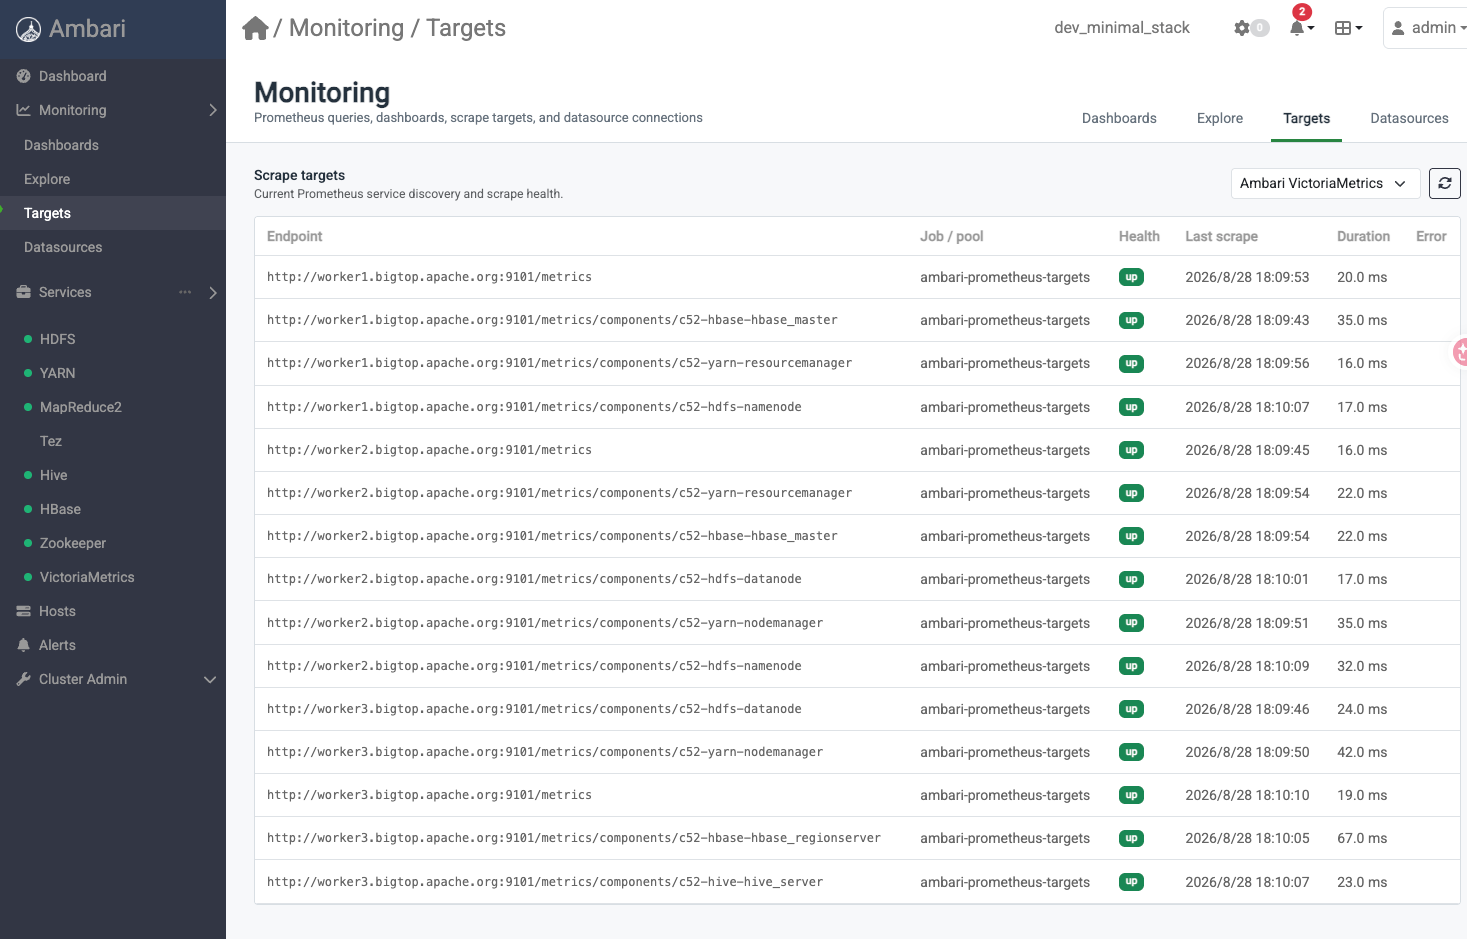 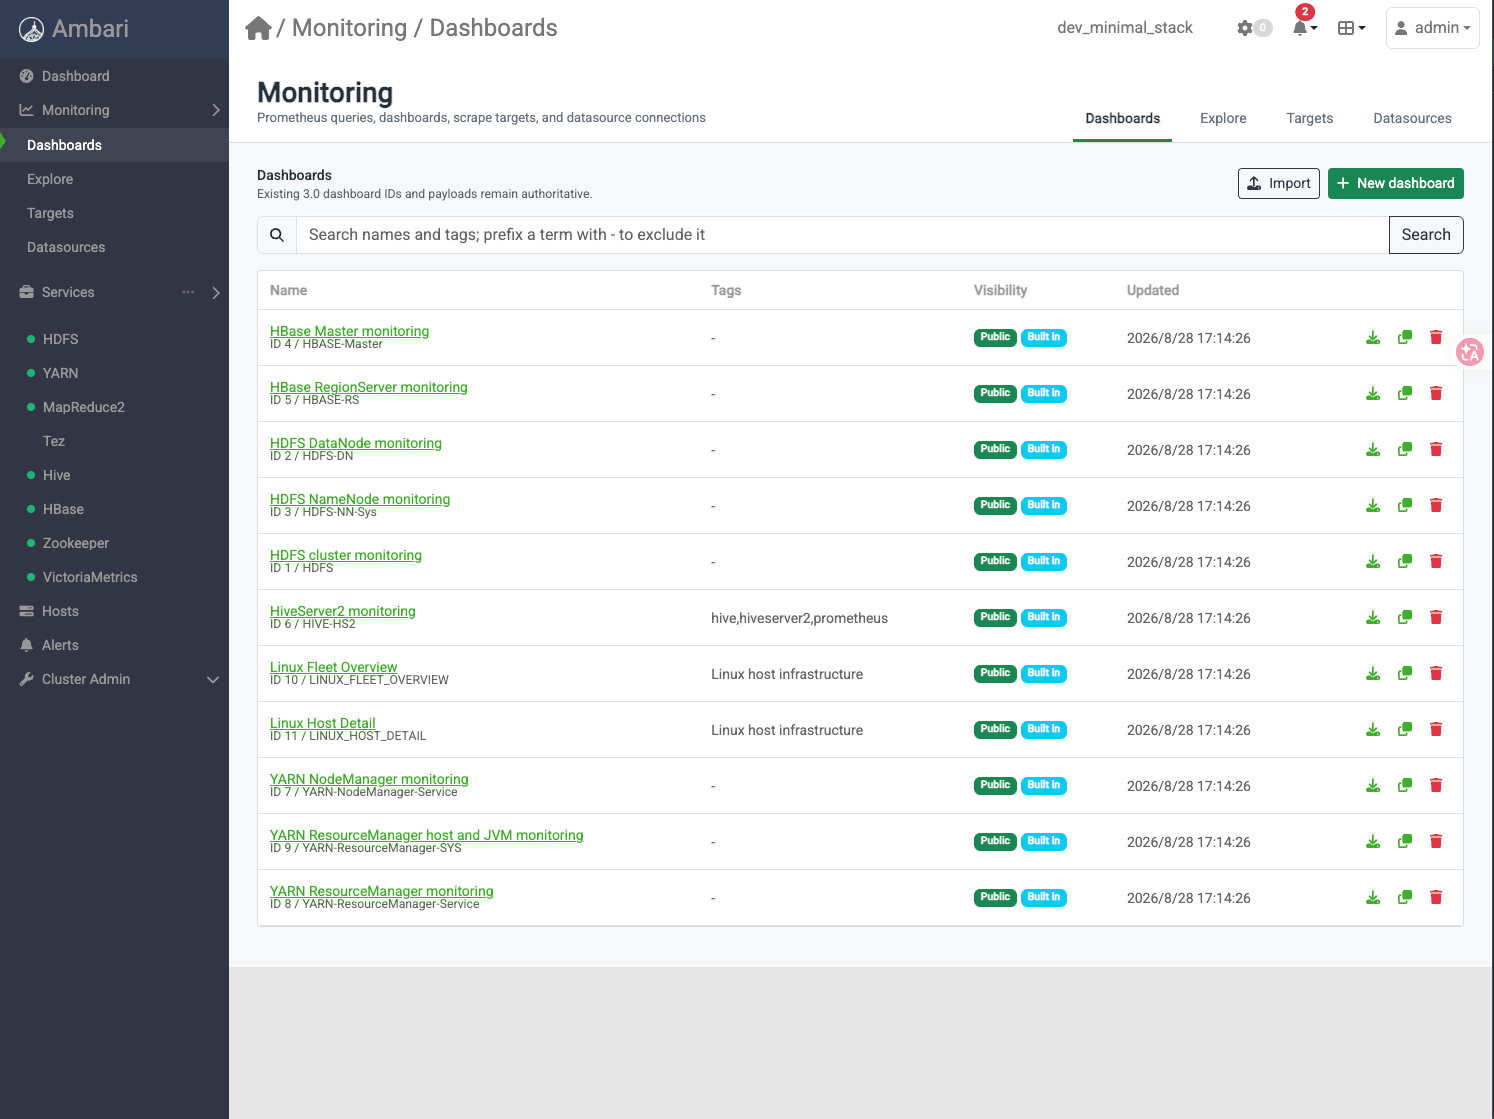 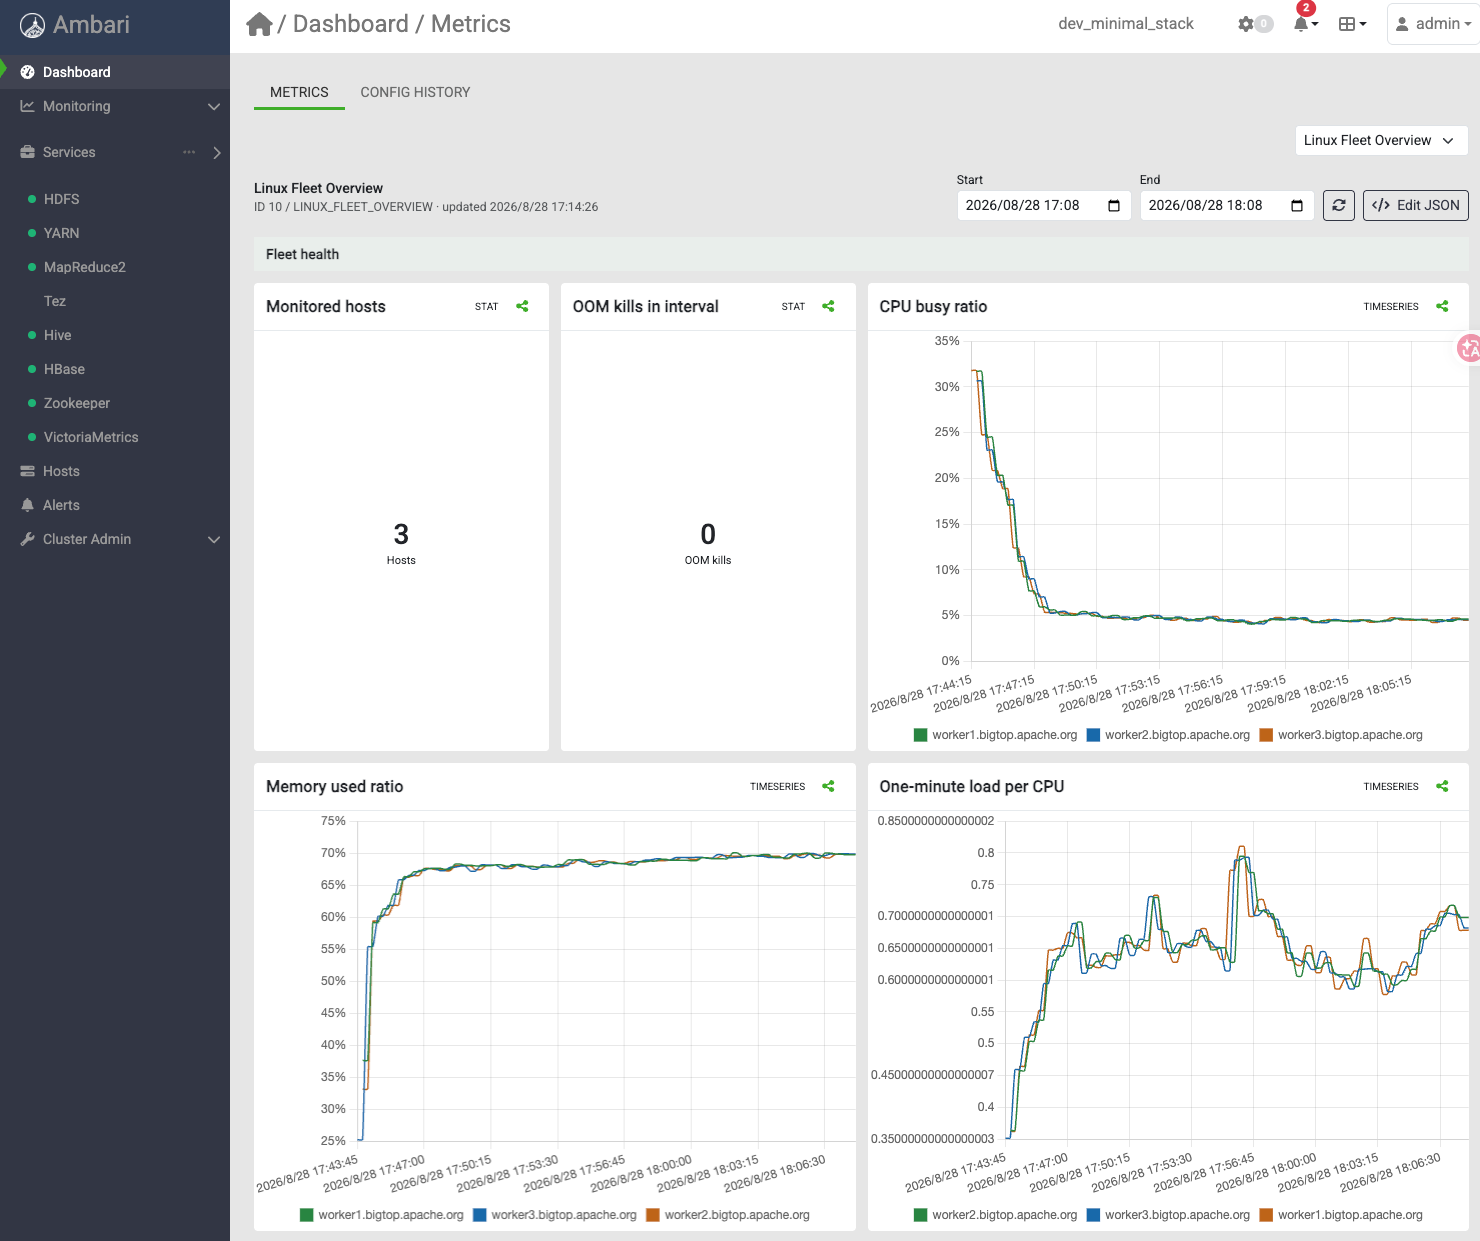 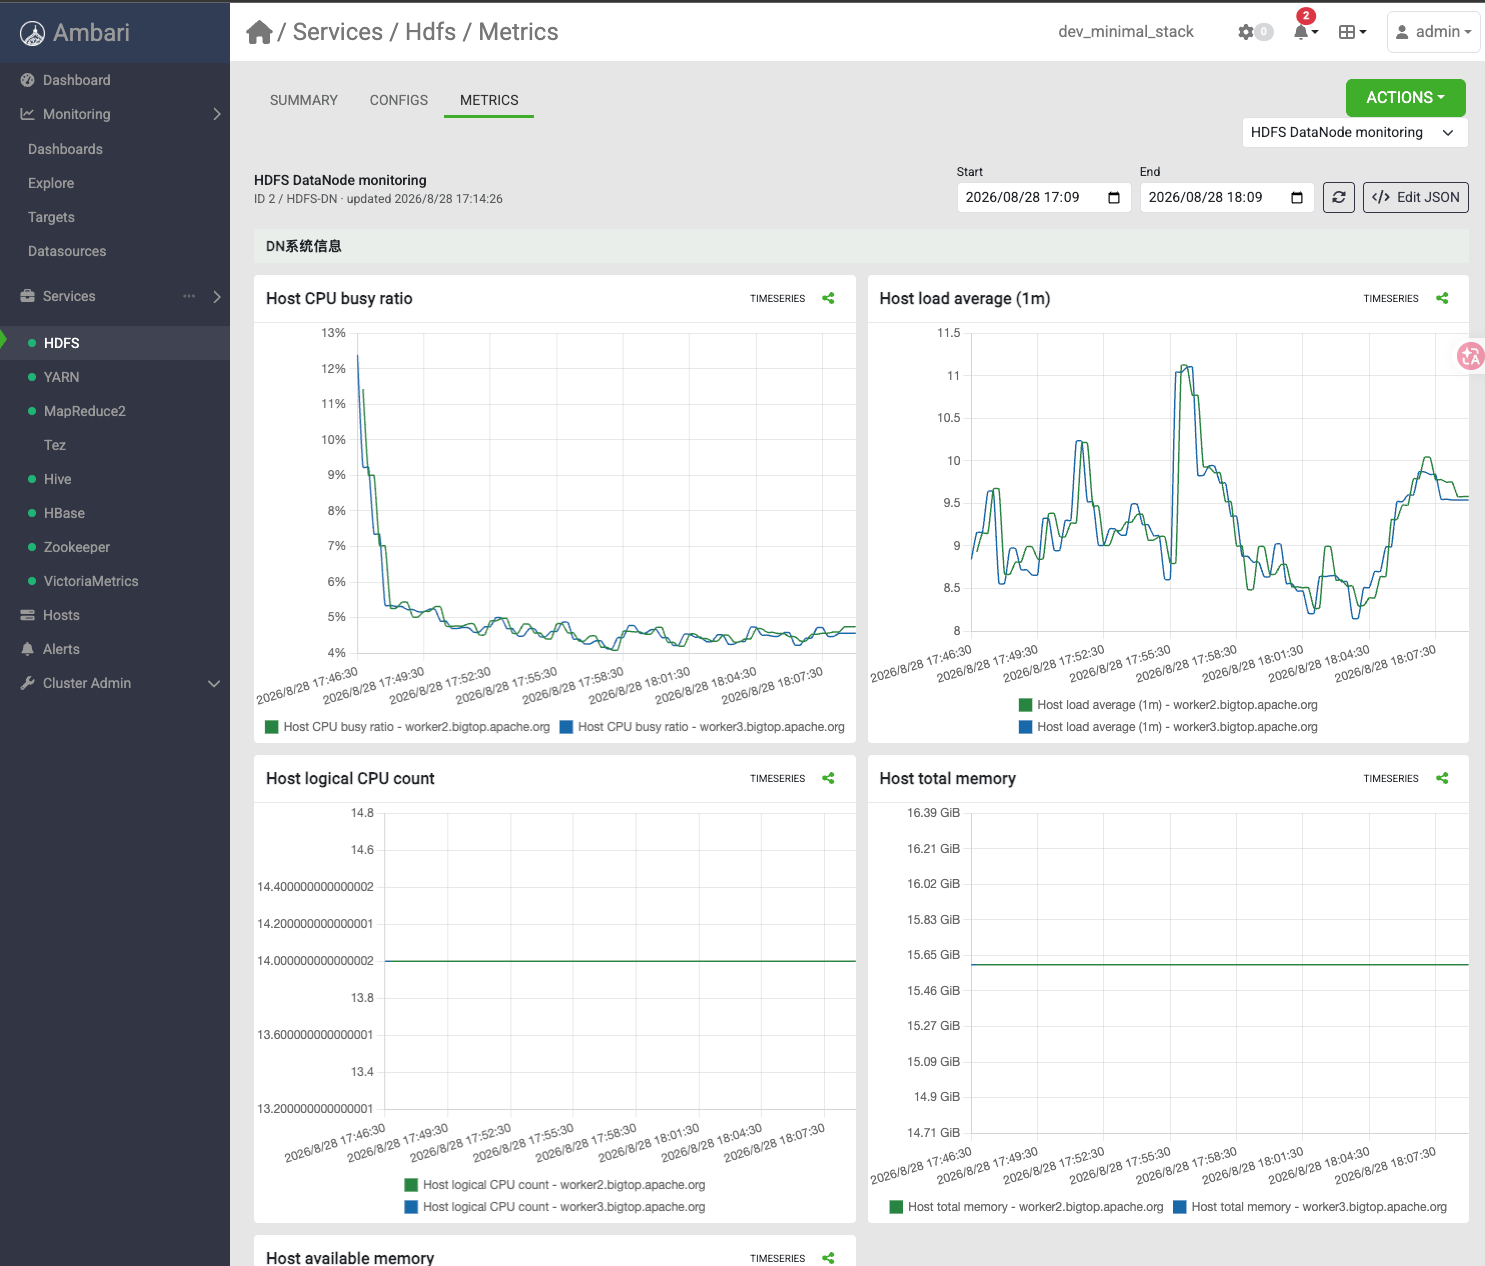 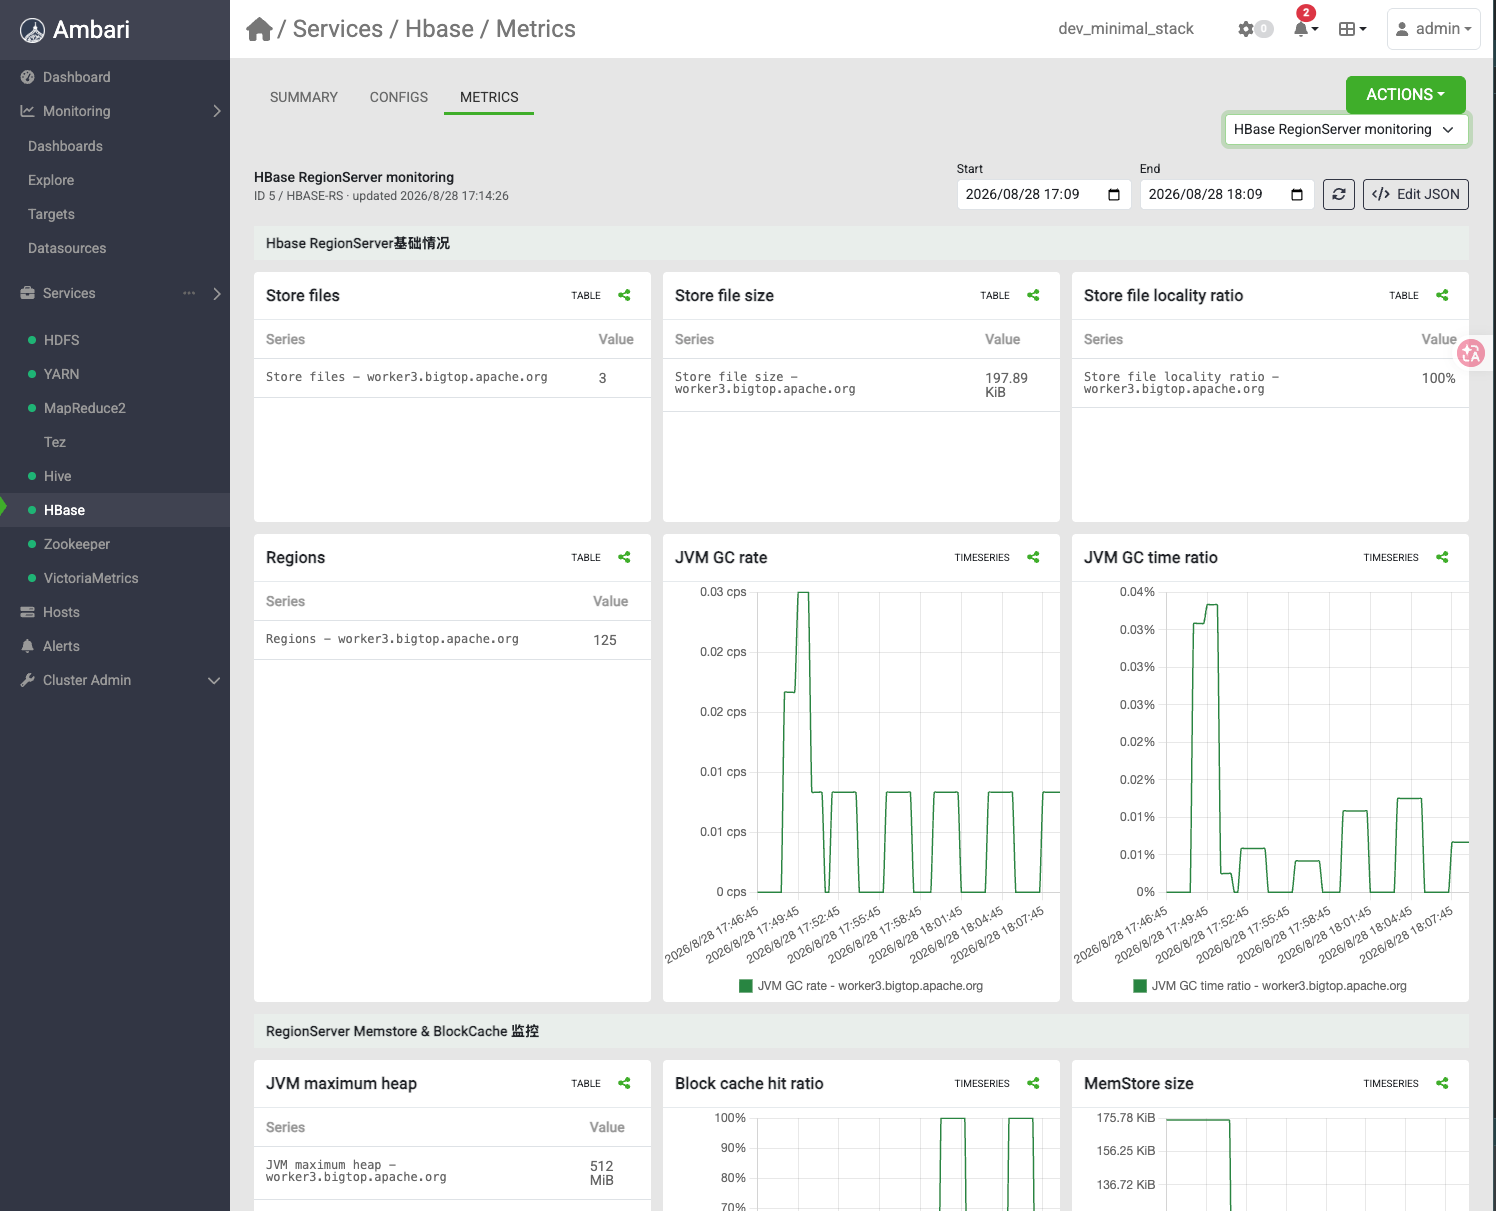 Please review [Ambari Contributing Guide](https://cwiki.apache.org/confluence/display/AMBARI/How+to+Contribute) before opening a pull request. -- This is an automated message from the Apache Git Service. To respond to the message, please log on to GitHub and use the URL above to go to the specific comment. To unsubscribe, e-mail: [email protected] For queries about this service, please contact Infrastructure at: [email protected] --------------------------------------------------------------------- To unsubscribe, e-mail: [email protected] For additional commands, e-mail: [email protected]






