jimmylao edited a comment on issue #52:
URL:
https://github.com/apache/incubator-bluemarlin/issues/52#issuecomment-1058102582
@Bimlesh759-AI Thanks for sharing. As shown in the table below, the ratios between positive and negative samples are 1.07 in training data and 2.66 in testing data. These are balanced (good) ratios. <html xmlns:v="urn:schemas-microsoft-com:vml" xmlns:o="urn:schemas-microsoft-com:office:office" xmlns:x="urn:schemas-microsoft-com:office:excel" xmlns="http://www.w3.org/TR/REC-html40";> <head> <meta name=ProgId content=Excel.Sheet> <meta name=Generator content="Microsoft Excel 15"> <link id=Main-File rel=Main-File href="file:///C:/Users/zlao/AppData/Local/Temp/msohtmlclip1/01/clip.htm"> <link rel=File-List href="file:///C:/Users/zlao/AppData/Local/Temp/msohtmlclip1/01/clip_filelist.xml"> <!--table {mso-displayed-decimal-separator:"\."; mso-displayed-thousand-separator:"\,";} @page {margin:.75in .7in .75in .7in; mso-header-margin:.3in; mso-footer-margin:.3in;} tr {mso-height-source:auto;} col {mso-width-source:auto;} br {mso-data-placement:same-cell;} td {padding-top:1px; padding-right:1px; padding-left:1px; mso-ignore:padding; color:black; font-size:11.0pt; font-weight:400; font-style:normal; text-decoration:none; font-family:Calibri, sans-serif; mso-font-charset:0; mso-number-format:General; text-align:general; vertical-align:bottom; border:none; mso-background-source:auto; mso-pattern:auto; mso-protection:locked visible; white-space:nowrap; mso-rotate:0;} .xl65 {text-align:center;} .xl66 {mso-number-format:Percent;} .xl67 {color:#24292F; font-family:"Segoe UI", sans-serif; mso-font-charset:0; mso-number-format:"\#\,\#\#0"; text-align:center;} --> </head> <body link="#0563C1" vlink="#954F72"> | positive # | negative # | pos vs neg ratio | % -- | -- | -- | -- | -- train | 217,949,105 | 233,029,477 | 1.069192172 | 87.16% test | 18,131,220 | 48,307,204 | 2.66431073 | 12.84% </body> </html> One approach you may want to try is: keep all testing samples and randomly drop 50% of training samples, then train a model to see if there's significant drop in AUC for testing samples. (Since the ratio of testing samples is 13%-, it has much less contribution to training time). Based on your keyword break-down sample information, it looks good too. The following are curves of accumulated percentage of training and testing samples with all keywords. It shows that keyword samples agrees well in training and testing. 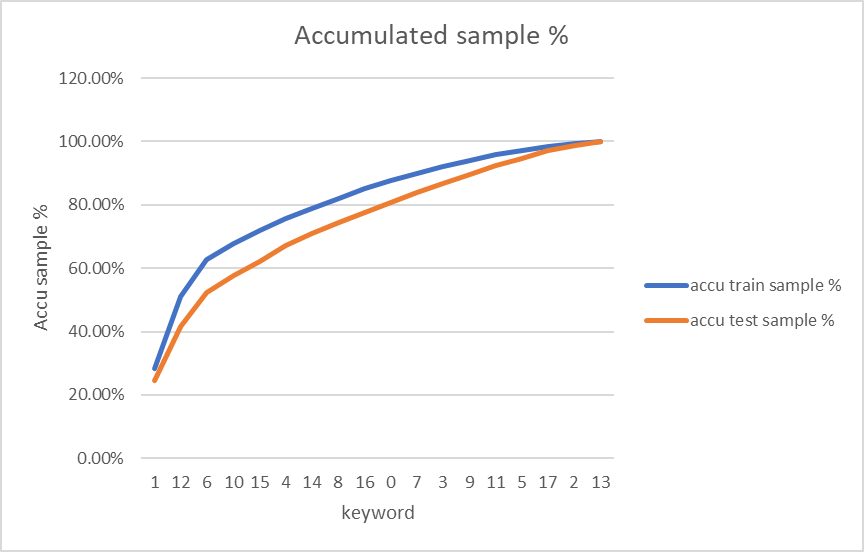 -- This is an automated message from the Apache Git Service. To respond to the message, please log on to GitHub and use the URL above to go to the specific comment. To unsubscribe, e-mail: dev-unsubscr...@bluemarlin.apache.org For queries about this service, please contact Infrastructure at: us...@infra.apache.org