rusinikita opened a new issue, #5564:
URL: https://github.com/apache/incubator-devlake/issues/5564
### Search before asking - [X] I had searched in the [issues](https://github.com/apache/incubator-devlake/issues?q=is%3Aissue) and found no similar feature requirement. ### Use case - As a tech lead, I want to focus my team on reaching a heathy workspace - As a tech lead, I want to track team's mood and opinions on different aspects of work - As a organization lead, I want to see if teams are trying to improve the healtyness of their workspace - As a organization lead, I want to see common teams problems in DevEx, DevOps and R&D ### Description ## Motivation The [goal of DevLake](https://devlake.apache.org/docs/Overview/Introduction) is to extract insights for engineering excellence and developer experience. Developer experience and quality should not be judged solely on technical data. Teams may want to track their maturity and success in different aspects of their work. [Team health check](https://engineering.atspotify.com/2014/09/squad-health-check-model/) is a good example of how to do that. There are good quality tools that allow you to do this ([teamretro](https://www.teamretro.com/health-checks/team-health-check), [teamhealthcheck](https://teamhealthcheck.io)). But, there are no good open-source and own-your-data tools available (only forbidden [1](https://github.com/johnpolacek/team-health-checker), [2](https://github.com/myftija/squad-health-check)). DevLake can easily provide this functionality. ## [Metric page documentation](https://devlake.apache.org/docs/Metrics/RequirementLeadTime) draft Metric name - health check. ### What is this metric Historic changes of team opinion/voting about different aspects of work. 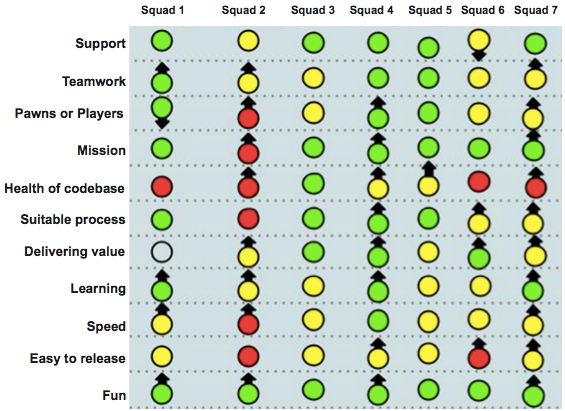 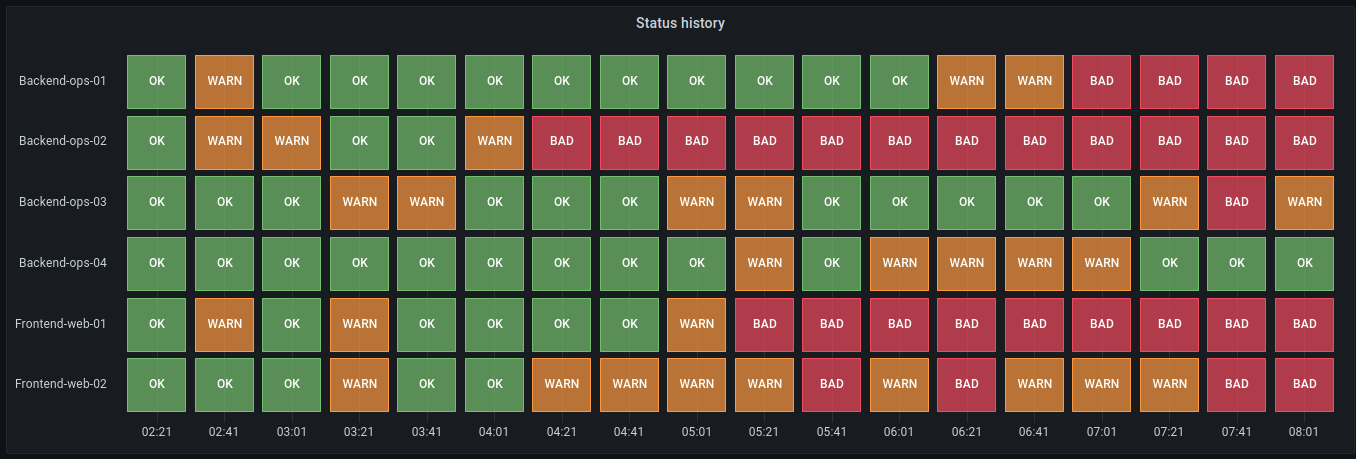 ### Why is it important? 1. Analyze team mood trends on different topics, identify areas "to save" and "to improve", and reduce staff turnover. 2. Focus on team values and goals to ensure everyone is on the same page 3. Combine objective and subjective data for better understanding of team problems. Many subjective factors can influence developer efficiency and staff turnover. There is a technique for easily tracking and visualizing these factors: the Spotify Squad Health Check [1 part](https://engineering.atspotify.com/2014/09/squad-health-check-model/), [2 part](https://engineering.atspotify.com/2023/03/getting-more-from-your-team-health-checks) ### Which dashboard does it exist in - Team health dashboard - Company health dashboard ### How to collect data? 1. Organize regular voting sessions to collect the current state of different development aspects. This can be added to a [retrospective meeting](https://www.atlassian.com/team-playbook/plays/retrospective) or a new ritual can be created. Voting can be anonymous or not. 2. Save votes in DevEx and track the trend of different aspects over time. 3. Discuss problems and write action items to address them. Any software can be used for voting and data can be saved through a webhook. - Check out this [Google sheets template](https://docs.google.com/spreadsheets/d/18O8MLJr48fY2_WNhTHJnIt3xtAnk-Ugths4MrdYjQu0/edit?usp=sharing) - Google forms, Airtable - Paper stickers ### How is it visualised? #### **Individual team** 1. Votes are filtered by team and grouped by date and topic, and then visualized in a heatmap where the date - column and the topic - row.  2. Votes are filtered by team and grouped by date and topic, and then changes trend is calculated and visualized as a red/yellow/green gauge with improvement speed. 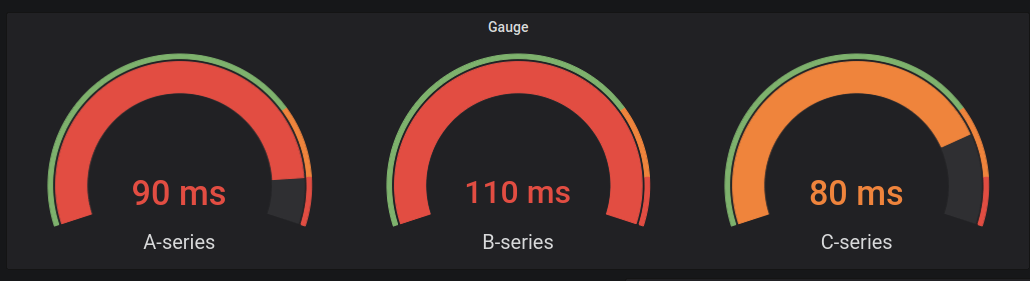 #### **Multi team** - Votes are grouped by team, date, and topic, and then the current value and trend are calculated and visualized in a heatmap where the team - column and the topic - row. - The cell color represents the current value, and the cell text represents the improvement speed.  ### How to not improve - You should compare teams by current state and improvement speed. You must not care about the different situation in different teams. - You should create KPIs on reaching good states in a limited time. You want to hear only good news, they must do or lie. - You should force a final set of questions/topics to track. You need only metrics. No creativity, no people's desires. ### How to improve - Track data regularly and discuss it. - Decide which technical metrics will help to understand and track problems based on solid data, such as cycle time, bug count, and code quality. - Create and implement action items. Ask for external help or consulting if there is no improvement. ## Solution design 1. A votes table for storing voting results. 2. A new POST method in the webhook plugin for notifying votes. ### Solution pros - Minimal changes required. No changes in DevLake config or UI. - Any UI can be used, and any data can be converted to this format. - The table can be used for alternative mechanics, such as team members' thanks count. ### Solution cons - An external UI voting tool is required. ### Related issues _No response_ ### Are you willing to submit a PR? - [X] Yes I am willing to submit a PR! ### Code of Conduct - [X] I agree to follow this project's [Code of Conduct](https://www.apache.org/foundation/policies/conduct) -- This is an automated message from the Apache Git Service. To respond to the message, please log on to GitHub and use the URL above to go to the specific comment. To unsubscribe, e-mail: [email protected] For queries about this service, please contact Infrastructure at: [email protected]